› Forums › Indicator discussion › MTH – Sergio Borsani Indicators (must have)
This topic has been reported for inappropriate content
Tagged: Candles, Harmonic Patterns, indicator, Market Profile, Mini Charts, MTH, Overlays, Sergio Borsani
- This topic has 89 replies, 17 voices, and was last updated 7 years, 4 months ago by
 Hollywood The Trade King.
- AuthorPosts
- January 14, 2015 at 7:17 am #3928
Disclaimer and Warning.
==================================================================================
1. All of my share here is for educational purpose only.
2. All tools or systems share here ‘freely’ as is and with your own risk.
3. Past performance could not guarantee future result.
4. If sometimes in the future, someone contact you by e-mail or Private Messages or by other way of communications and acting or pretending like me, and asking for help and/or requesting money for any reason. Please IGNORE IT immediately.. and please post your finding / inform our forum admin.
===================================================================================
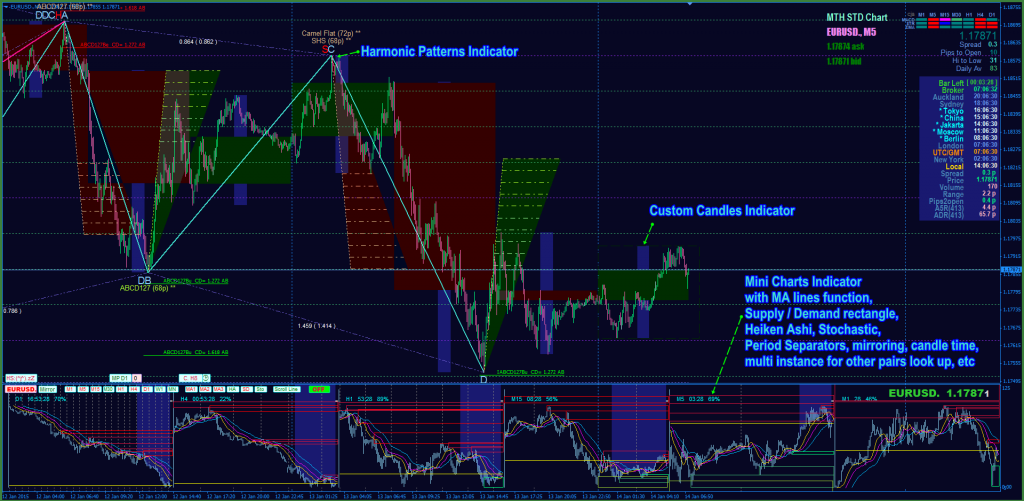
Hi Guys, this is the great Indicators from brilliant coder Sergio Borsani;
– Market Profile Indicator
-Overlay Chart Indicator
-Harmonic Pattern Indicator
-Custom Candle Indicator
-Mini Chart Indicator (great for you, highly recommended)

Most Indicators offline charts friendly..
Please post here if you want to ask something related to this indicators, I will try to help as far as I know..
Enjoy..
Hope it help and best regards
MTH
Edit : As Requested by our Brother Sergio Borsani.
You could check for updates and other great Indicators/Tools from his site, you can go here : Sergio Borsani site
Best Regards
MTH
-
This topic was modified 11 years, 6 months ago by MTH2014. Reason: adding Sergio Borsani website link
-
This topic was modified 11 years, 6 months ago by MTH2014.
-
This topic was modified 11 years, 6 months ago by MTH2014.
Attachments:
You must be logged in to view attached files.Intuition, Experiences and Common sense..
http://www.binaryoptionsedge.com/January 14, 2015 at 1:33 pm #3984This reply has been reported for inappropriate content.
Hi Kiads.
I see that you visited my site and I’m honored for that.
I also see that you did not mention how to get there, I beg you publish the site address if you can do it in this forum.
From already thank you for your interest and consideration for my work.
Sergio
My apologies, my biggest limitation: write in English
January 14, 2015 at 2:02 pm #3988This reply has been reported for inappropriate content.
Hi Kiads. I see that you visited my site and I’m honored for that. I also see that you did not mention how to get there, I beg you publish the site address if you can do it in this forum. From already thank you for your interest and consideration for my work. Sergio
Hi Brother, Wow.. Nice to Met You.. and See You here… .
Sure.. , would you please post/put your correct site address here, I believe Saver0 don’t mind, since You do Brilliant Job and has a great sharing mind..
Personally I will also put your site link to my personal e-mail..
Best Regards
MTH
Edit : already put your site link at post 1.
-
This reply was modified 11 years, 6 months ago by MTH2014.
-
This reply was modified 6 years, 7 months ago by lohnere.
Intuition, Experiences and Common sense..
http://www.binaryoptionsedge.com/January 14, 2015 at 2:56 pm #3994This reply has been reported for inappropriate content.
Kiads
Thanks for your prompt reply and support
I’m working now in a new version of MiniCharts Gold with posibilty of see offline charts and may be RSX indi incorporated too, we’ll see if it comes out. Shame how quickly time passes.
Best Regards
Sergio
My apologies, my biggest limitation: write in English
January 14, 2015 at 3:43 pm #3996This reply has been reported for inappropriate content.
Hi Guys, this is the great Indicators from brilliant coder Sergio Borsani
Hey Kiads,
This looks interesting!
 Can you provide a link to the origin of those indicators to find some more background information?
Cheers, simplex
A good trader is a realist who wants to grab a chunk from the body of a trend, leaving top- and bottom-fishing to people on an ego trip. (Dr. Alexander Elder)
January 14, 2015 at 4:14 pm #3997This reply has been reported for inappropriate content.
Hi Guys, this is the great Indicators from brilliant coder Sergio Borsani
Hey Kiads, This looks interesting!
Can you provide a link to the origin of those indicators to find some more background information? Cheers, simplexThere is a Sergio Borsani website link at post 1 Brother..
Best Regards
MTH
Intuition, Experiences and Common sense..
http://www.binaryoptionsedge.com/January 15, 2015 at 12:07 am #4008This reply has been reported for inappropriate content.
Hello guys
New and unpublished, freshly uploaded to the site.
With the permission of Kiads brother (I know he is the administrator of the thread, not me).
Check up a new 5thDimension indicator on my site (site link in post 1).
In common charts candles the range is given by the price, in the 5thDimension the range is given by the volume.
The graph shows interesting things, though of uncertain utility in practice,
if someone finds some let us know (job of lab, I have no time for that).Main difficulty: different brokers with different volumes = graphics different in 5thdimension? I think so but not know how much different can be because really it is a question of volume ratio between the candles.
Sergio.
-
This reply was modified 11 years, 6 months ago by Sergio Borsani.
My apologies, my biggest limitation: write in English
January 15, 2015 at 3:18 am #4016This reply has been reported for inappropriate content.
Hello guys New and unpublished, freshly uploaded to the site. With the permission of Kiads brother (I know he is the administrator of the thread, not me). Check up a new 5thDimension indicator on my site (site link in post 1). In common charts candles the range is given by the price, in the 5thDimension the range is given by the volume. The graph shows interesting things, though of uncertain utility in practice, if someone finds some let us know (job of lab, I have no time for that). Main difficulty: different brokers with different volumes = graphics different in 5thdimension? I think so but not know how much different can be because really it is a question of volume ratio between the candles. Sergio.
Cool.. Brother.. I use it by comparing the percentage range using fibo retracement, and looking for divergences and convergences.. It’s really interesting..

Maybe a little suggestion, perhaps you could change your value 6 (buffer 6) to become buffer 0, so we can overlay standard indicator like MA or Bollinger Band to look up array on buffer 0.. that may help a lot to make further analysis on tick volume movement..
Best Regards
MTH
Intuition, Experiences and Common sense..
http://www.binaryoptionsedge.com/January 15, 2015 at 4:47 am #4018This reply has been reported for inappropriate content.
I see that you visited my site and I’m honored for that. I also see that you did not mention how to get there, I beg you publish the site address if you can do it in this forum. From already thank you for your interest and consideration for my work.
Really nice work there Sergio!

Welcome to the forum!

Focus, Patience, Determination & Order in chaos
January 15, 2015 at 9:11 am #4033This reply has been reported for inappropriate content.
Dear Bro Kiads
Can I have this indicator please? I downloaded the one from Sergios Website, but this one is different. Kindly share this 5th Dimension indicator based on fibo levels. Also kindly share this fibo as well please.
Regards
Your Secret Admirer :)
January 15, 2015 at 9:28 am #4034This reply has been reported for inappropriate content.
Thanks Kiads for publishing here these beautfull indicators and thanks Sergio for the great work.
Green pips to you
January 15, 2015 at 4:10 pm #4055This reply has been reported for inappropriate content.
Brother Kiads
I understand that you request for Buffer 0 pointing to Close of candle
Image attached showing SMA50 (with Apply to: Last Indicator’s Data) on the 5thDimension indicator.
Problem: You see, the indicator is WYSIWYG, he does not see what is to the left or to the right of the chart window
Possible solution only if it is justified to do so: generate a chart offline, more easy to say which do
Here it is (in the site later)
NO! with the modification the modified indi hangs the platform, attachment deleted

-
This reply was modified 11 years, 6 months ago by Sergio Borsani.
-
This reply was modified 11 years, 6 months ago by Sergio Borsani.
-
This reply was modified 11 years, 6 months ago by Sergio Borsani.
-
This reply was modified 11 years, 6 months ago by Sergio Borsani. Reason: Modified indi hangs the platform
-
This reply was modified 6 years, 7 months ago by lohnere.
Attachments:
You must be logged in to view attached files.My apologies, my biggest limitation: write in English
January 15, 2015 at 4:46 pm #4060This reply has been reported for inappropriate content.
Really nice work there Sergio!
Welcome to the forum! Thank Saver0, I will try to live up to the expectations.
Sergio
My apologies, my biggest limitation: write in English
January 15, 2015 at 10:26 pm #4067This reply has been reported for inappropriate content.
autopsy of 5thDimension modified for buffer 0 –> Close of candle
– With Moving Average it work ok, the image in #4055 shows it
– With Bollinger Bands the platform hang up
Sorry friends, in this moment I don’t understand what is happening

I’m thinking out loud, obviously the problem is related to the standard deviation calculated by bollinger bands, will it be the scale for the graph?
I still think, the problem must be that the indi is WYSIWYG, see in the image that the MA makes a vertical start. What would be the result of applying the standard deviation to this MA ?. Surely overflow and the platform does not seem to be prepared to handle it. We can not fix the starting point to Bollinger like we can not fix the starting point to MA. How are things this does not seem to have a solution.
I wonder if anyone will understand what I mean.
-
This reply was modified 11 years, 6 months ago by Sergio Borsani. Reason: I still think
My apologies, my biggest limitation: write in English
January 16, 2015 at 2:27 am #4083This reply has been reported for inappropriate content.
autopsy of 5thDimension modified for buffer 0 –> Close of candle – With Moving Average it work ok, the image in #4055 shows it – With Bollinger Bands the platform hang up Sorry friends, in this moment I don’t understand what is happening
I’m thinking out loud, obviously the problem is related to the standard deviation calculated by bollinger bands, will it be the scale for the graph? I still think, the problem must be that the indi is WYSIWYG, see in the image that the MA makes a vertical start. What would be the result of applying the standard deviation to this MA ?. Surely overflow and the platform does not seem to be prepared to handle it. We can not fix the starting point to Bollinger like we can not fix the starting point to MA. How are things this does not seem to have a solution. I wonder if anyone will understand what I mean.Hi Brother, just maybe.., could we create buffer 0 with complete separate calculation formula for that tick volume candles (user price selectable..) and for the whole bars or with max bars option, so we could feed data normally to other standard indicators with on array function to overlay on top of ‘her’, while other buffers could still provide visual volume candles with that wysiwyg.
Best Regards
MTH
Intuition, Experiences and Common sense..
http://www.binaryoptionsedge.com/January 16, 2015 at 2:49 am #4084This reply has been reported for inappropriate content.
Dear Bro Kiads
Can I have this indicator please? I downloaded the one from Sergios Website, but this one is different. Kindly share this 5th Dimension indicator based on fibo levels. Also kindly share this fibo as well please. Regards Your Secret Admirer :)Hi Brother, I also download exactly the same 5th Dimension Indicator from our Brother Sergio Borsani site. I just change fixed minimum -20 or -25 and fixed maximum to 120 or 125, and add different color horizontal lines at level 0, 25, 50, 75 and 100.
for Fibo Retracement setting I use Level/Description 0 / 00% , 1 / 25%, 2/50%, 3/75%, and 4/100% or you could add price value to your fib retracement by writing in description setting like; 00 pct – %$, 25 pct – %$, etc.
then search for latest volume candles that first ‘touch’ 25 to 0 levels or in the other side from 75 to 100 levels and mark them by vertical lines, and next measure the highest to the lowest v.v. of main chart candles inside the area between that 2 vertical lines (if only 1 candle then simply measure ‘her’ high/low). and put my fib retracement lever to that high/low point as 25% range.
For example if there is bearish volume candle that ‘touch’ 0 level at 5th dimension indicator, with ‘her’ high cover range between level 25 to 0. then look at the main chart for correspond candle and consider this main chart bearish candle high to low as 25% range of our fibo, and when and only if the next candle is in bullish form, you may look to go long with the target range of your fib retracement levels.
Hope it help and best regards
MTH
Intuition, Experiences and Common sense..
http://www.binaryoptionsedge.com/January 16, 2015 at 12:13 pm #4095This reply has been reported for inappropriate content.
wow sir and thnx to the owner this what I was requestin you but is only that one cant put a different pair on minichart can it be made so one can chose the pair he want to view on subwindow even though the main window is another pair?another thing is it possible to be made not only for offline charts but for the others too
January 16, 2015 at 12:25 pm #4099This reply has been reported for inappropriate content.
wow sir and thnx to the owner this what I was requestin you but is only that one cant put a different pair on minichart can it be made so one can chose the pair he want to view on subwindow even though the main window is another pair?another thing is it possible to be made not only for offline charts but for the others too
Hi Brother, If you talking about Sergio Borsani MiniChart Gold, Yes of course this superb MiniChart Indicator could display any pairs you want while the main chart display other pair, so you can see GBPUSD and USDJPY in your mini charts Indicators (use 2 instance of mini chart indicator with different ID), while your main chart show GBPJPY. and yes of course ‘she’ work on standard candlestick charts and offline chart like Renko and CRB.
Best Regards
MTH
Intuition, Experiences and Common sense..
http://www.binaryoptionsedge.com/January 16, 2015 at 12:34 pm #4102This reply has been reported for inappropriate content.
autopsy of 5thDimension modified for buffer 0 –> Close of candle – With Moving Average it work ok, the image in #4055 shows it – With Bollinger Bands the platform hang up Sorry friends, in this moment I don’t understand what is happening
I’m thinking out loud, obviously the problem is related to the standard deviation calculated by bollinger bands, will it be the scale for the graph? I still think, the problem must be that the indi is WYSIWYG, see in the image that the MA makes a vertical start. What would be the result of applying the standard deviation to this MA ?. Surely overflow and the platform does not seem to be prepared to handle it. We can not fix the starting point to Bollinger like we can not fix the starting point to MA. How are things this does not seem to have a solution. I wonder if anyone will understand what I mean.Hi Sergio
,how would be using WPR with definite starting point say few hundred timeframes, is that possible ( I recall seeing it controlled time/price space (vertical/horizontal) somewhere ) ? Just a thought late at night…..
cheers
h
January 16, 2015 at 1:10 pm #4108This reply has been reported for inappropriate content.
is it possible for the indicator to show on other chart rather than offline
January 16, 2015 at 3:15 pm #4112This reply has been reported for inappropriate content.
Hi all
wow sir and thnx to the owner this what I was requestin you but is only that one cant put a different pair on minichart can it be made so one can chose the pair he want to view on subwindow even though the main window is another pair?another thing is it possible to be made not only for offline charts but for the others too
Hi Brother, If you talking about Sergio Borsani MiniChart Gold, Yes of course this superb MiniChart Indicator could display any pairs you want while the main chart display other pair, so you can see GBPUSD and USDJPY in your mini charts Indicators (use 2 instance of mini chart indicator with different ID), while your main chart show GBPJPY. and yes of course ‘she’ work on standard candlestick charts and offline chart like Renko and CRB. Best Regards MTH

(use 2 instance of mini chart indicator with different ID) <- Different ID is not necesary, there isn’t any parameter for this, it’s automatic.
- Number max of instances per chart allowed: 10
Hi Sergio
, how would be using WPR with definite starting point say few hundred timeframes, is that possible ( I recall seeing it controlled time/price space (vertical/horizontal) somewhere ) ? Just a thought late at night….. cheers hForgive me Hannele, I don’t understand what you mean and, what is WPR?
is it possible for the indicator to show on other chart rather than offline
Bro Fxrambo. Be more especific. What indicator?. Indicators in offline charts is the exception it’s not the rule, in any case just try. Please read anterior posts.
Brother Kiads
I’m working in your idea on 5thDim (#4083), it’s not that easy (scale problems with current code, unexplained with my poor English)
Another problem, more difficult to resolve: the gaps. The gaps not have volume. 5Th Dim 14AB solves it synthesizing a gap by assigning a ratio proportional to volume / range of previous bar to the gap in price. That is satisfactory?. Certainly not but not show the gap is worse. Any other idea?
To do list: Add bool parameter: Show Synthesized Gap
Sergio
My apologies, my biggest limitation: write in English
January 16, 2015 at 3:27 pm #4114This reply has been reported for inappropriate content.
Brothers help me please.
How do I insert images in posts?.
Second intent and failed, I’m a little fool
Sergio
-
This reply was modified 11 years, 6 months ago by Sergio Borsani.
My apologies, my biggest limitation: write in English
January 16, 2015 at 4:05 pm #4120This reply has been reported for inappropriate content.
Brothers help me please. How do I insert images in posts?. Second intent and failed, I’m a little fool Sergio
Hi Brother Sergio, I use external image hosting (photo bucket), I upload my pictures there, then click share and select direct link, then here in my post i click the picture icon and paste the link.. that’s it..
btw please also forgive my bad English, is not my native language too… lol.
Best Regards
MTH
Intuition, Experiences and Common sense..
http://www.binaryoptionsedge.com/January 16, 2015 at 4:19 pm #4123This reply has been reported for inappropriate content.
How do I insert images in posts?.
Hi Sergio,
You are not the only one.. the image attach feature isn’t as obvious. I need to make it more user friendly when I have more time. Here are the stepsQuickest way
- Write your reply and under Attachments, select the image file that you want to attach and click save.
This will save the image as an attachment and will show up below your post as a thumbnail that people will be able to expand by clicking.
Longer way
- First attach the image as instructed above
- Then save the post.
- Right click on the image and click on “Copy link address” in order to copy the large image URL
- Now edit the post again
- Click on the little “Insert/edit image” icon in the text editor to insert the image to the post where you want it inserted. Image will be inserted to where the cursor is
- Under the source field, paste the copied image address
- You can adjust the image dimension (size) and click on OK. Now the image will be inserted to the post.
- Click submit to make your changes.
I understand the instructions are long but once you do it a couple of times, it will get easier. You can also user an external image hosting service such as http://prntscr.com/ to upload the image and then just get the image URL and then insert (image URL has to end in image extension like .jpg .png .gif etc)
I hope this helps
Focus, Patience, Determination & Order in chaos
January 16, 2015 at 6:56 pm #4136This reply has been reported for inappropriate content.
Kiads and Saver0
Testing now

Thank you very much to both, now I could!.

Sergio
My apologies, my biggest limitation: write in English
-
This topic was modified 11 years, 6 months ago by
- AuthorPosts


- You must be logged in to reply to this topic.