gg53 replied to the topic Currency Strength in the forum General Discussions 11 years, 2 months ago
The price chart or “indicator” have ONLY two things to show you:
Price on the Y axis and Time on the X axis – per currency pair.
“Price” is your “friend”,
“Time” is your “Enemy”.
That’s too little info to trade. ALL standard indicators are just following the price, and lagging.
In order to gain more info to trade with more confident you…[Read more]
-
gg53 replied to the topic Currency Strength in the forum General Discussions 11 years, 2 months ago
I suggest you waste your time trying all possible combinations of that CC indicator. It’s easy to do with MT4 optimization, and try to come up with EXACT match.
That’s going to be very fruitfull, contributing, and a step forward for this discussion…

On a more serious note, and to that forum subject (at last…):
I drew some…[Read more]
-
gg53 replied to the topic Currency Strength in the forum General Discussions 11 years, 2 months ago
I suggest you waste your time trying all possible combinations of that CC indicator. It’s easy to do with MT4 optimization, and come up with EXACT match.
That’s going to be very fruitfull, contributing, and a step forward for this discussion…
On a more serious note, and to that forum subject (at last…):
I drew some…[Read more]
-
gg53 replied to the topic Currency Strength in the forum General Discussions 11 years, 2 months ago
LearnAlways,
You should setup this indie at the start of a day or start of a session (broker’s time) to work properly.
“Market Profile” or “Market Statistics” & VWAP is too big subject, with many details, to explain here.
Good (and entertaining …) videos on the subject can be found here (mostly SWF…[Read more]
-
gg53 replied to the topic Currency Strength in the forum General Discussions 11 years, 2 months ago
LearnAlways,
“Market Profile” or “Market Statistics” & VWAP is too big subject, with many details, to explain here.
Good (and entertaining …) videos on the subject can be found here (mostly SWF format):
G.
-
gg53 replied to the topic Currency Strength in the forum General Discussions 11 years, 2 months ago
Isn’t by plainly looking at candlestick height (pips) the same as market profile??? If so why then do we need to put market profile, I mean what is the purpose or objective? Sorry to ask as my chart is full of indicators thus I like to ask myself this kinda question before putting one, to make it simpler. [/quote]
candlestick doesnt show you w…[Read more]
-
gg53 replied to the topic Currency Strength in the forum General Discussions 11 years, 2 months ago
Haha, you got me, very funny
 . I thought u got some secret weapon. Q) What does VWAP stands for??? [/quote]
VWAP = Volume Weighted Average Price.
It’s a measure of at what price is the largest volume of trades right now.
You can see it in every decent “Market Profile” or Market Statistics” indicator for MQ4.
G.
-
gg53 replied to the topic Currency Strength in the forum General Discussions 11 years, 2 months ago
I was joking…
Even if you connect to interbank network – 1 MINIMAL lot is 5 milion. USD.
That’s why banks doesn’t want us as direct customers and rather deal with brokers as a pool of tradedrs and to manage their margin.
G.
-
gg53 replied to the topic Currency Strength in the forum General Discussions 11 years, 2 months ago
You won’t see indicators there, because they don’t really “trade”.
They have orders to buy or sell $XXX according to their customers need, and don’t have much choice.
The only thing they need to do is to buy or sell at the best price within their time limit.
On large orders – they will manipulate the market. If they need to buy 50 milion USD,…[Read more]
-
gg53 replied to the topic Currency Strength in the forum General Discussions 11 years, 2 months ago
You won’t see indicators there, because they don’t really “trade”.
They have orders to buy or sell $XXX according to their customers need, and don’t have much choice.
The only thing they need to do is to buy or sell at the best price within their time limit.
On large orders – they will manipulate the market. If the need to buy 50 milion USD,…[Read more]
-
gg53 replied to the topic Currency Strength in the forum General Discussions 11 years, 2 months ago
Yes, bypass the broker and connect directly to interbank stream.
It costs a few $K per month, but worth every penny….
G.
-
gg53 replied to the topic Currency Strength in the forum General Discussions 11 years, 2 months ago
Align them to fit this…
G.
-
gg53 replied to the topic Currency Strength in the forum General Discussions 11 years, 2 months ago
The banks see “true” interbank prices from various sources (fractional differences between them).
The broker receive his liquidators (banks) prices + premium. Those prices are, again, slightly different from one another according to different banks, bids and Ask.
The broker shows you the more and most “expensive” prices and adds his premium…[Read more]
-
MTH2014 replied to the topic Currency Strength in the forum General Discussions 11 years, 2 months ago
Brother, You may look at wikipedia for further information and explanations. Maybe start with ‘trading room’ for search key…

MTH
-
MTH2014 replied to the topic Currency Strength in the forum General Discussions 11 years, 2 months ago
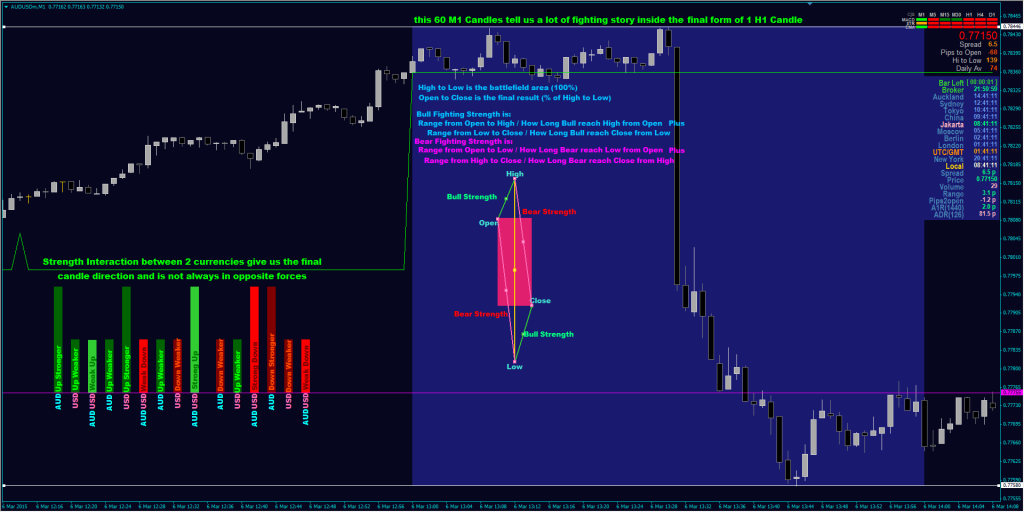
No Brother, that only visualization example of strength interaction between two currencies in pair to create final form of direction bias. In the OHLC format of information, the summary of all these interactions is only 2 state (from the movement point of view).
1. from Open goes to High first, then to Low and then to Close that mean…[Read more]
-
MTH2014 replied to the topic Currency Strength in the forum General Discussions 11 years, 2 months ago
No Brother, that only visualization example of strength interaction between to currencies in pair to create final form of direction bias. In the OHLC format of information, the summary of all these interactions is only 2 state (from the movement point of view).
1. from Open goes to High first, then to Low and then to Close that mean…[Read more]
-
MTH2014 replied to the topic Currency Strength in the forum General Discussions 11 years, 2 months ago
Just my own personal Opinion;
Naked chart IS an Indicator…
Yes, 100% correct.. What you see in your retail trading platform whatever is candlestick chart, line chart, bar chart, renko chart, constant range bar chart,kagi chart, point and figure chart, mountain chart, tick chart, 3 line break chart, etc.. are visualization attempt of what…[Read more]
-
MTH2014 replied to the topic Currency Strength in the forum General Discussions 11 years, 2 months ago
Just Adding ‘spicy’ to this great discussion…

MTH
- Load More