› Forums › Reversion Zones › All about reversion zones
- This topic has 24 replies, 4 voices, and was last updated 1 year, 10 months ago by
 Saver0.
- AuthorPosts
- August 28, 2024 at 5:31 pm #15710
Hi all!
I’m happy to share details about Reversion Zones to help you develop the concept further and make it a unique tool in your trading arsenal.
So what are Reversion Zones?
Some of you are probably familiar with the concept of mean reversion. Legendary Jim Simmons used this concept in many of his interviews. My idea of reversion zones is similar but different and uses geometry instead of mean to determine price levels that need to be revisited. This is why I use the new term instead of the mean reversion: it’s not the mean that we are after.Reversion zones result from sudden price moves caused by irrational behavior in price, driven by high greed or fear, which often balances itself out. You see this behavior often with the FOMC rate decisions.
People can use simple indicators, such as moving averages or MACD, or really any indicator, to detect these irrational movements. I will share with you today the breakthrough that I made. It’s all about fine-tuning any indicator to determine these irrational moves and the price level in which they took place to know the level at which the price will rebalance itself.
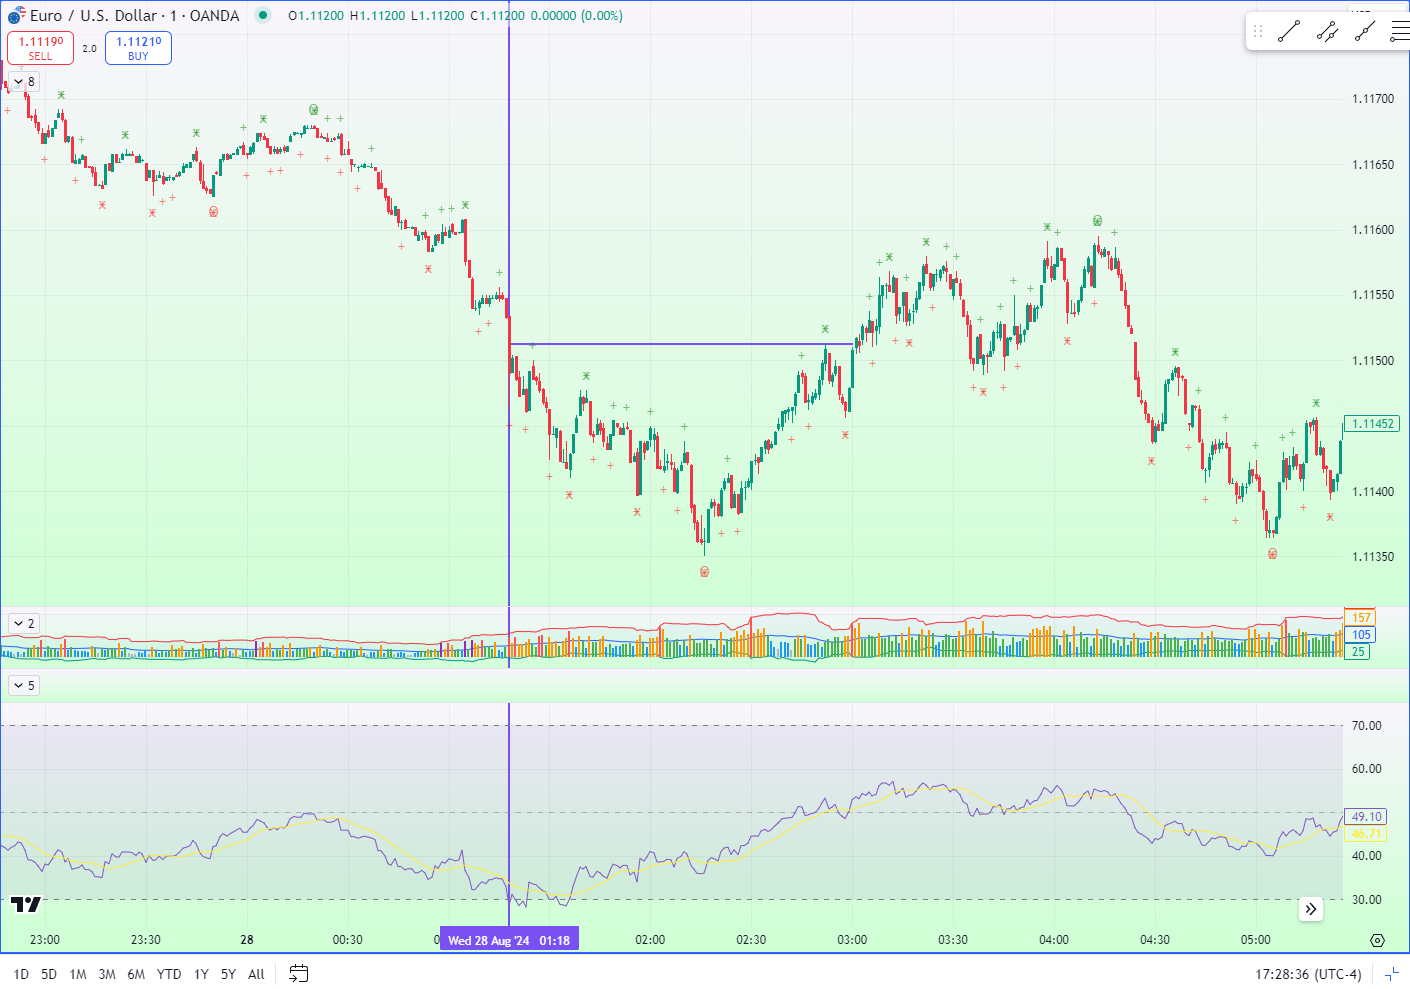
Here is an example with RSI:

Attachments:
You must be logged in to view attached files.Focus, Patience, Determination & Order in chaos
August 28, 2024 at 8:30 pm #15712Exciting surprise!
You have my attention.
And I’ll have to join the Beta for your Signals. I think I’d be a fool not to, hm?As-for this geometric reversion that you’ve been enlightened to, I would love to really grok how it works, and how to bolt it onto other indicators — but I also wonder how to not blow our collective cover and have it suddenly be Favorited by 10,000 people on TV, cannibalizing most of the alpha in the process. Though at least maybe by then, us old Penguins will have made our millions and moved to Mediterranean climates. ;)
Thank you for sharing, and no matter what happens, I wish you and yours a joyful, peaceful, healthy, wealthy, and wise life!
August 29, 2024 at 3:03 pm #15715Welcome back @PMMforex! I appreciate your vote of confidence and joining the Beta. As you start using it, you can drop into the Discord server or post your questions/feedback in this new topic that I made.
As for the system being exploited, I’m not going to share the exact details of the system that I have in production. Also, the paid product will be limited in the number of subscribers, with the top limit being 3000. I might even reduce it down to a few hundred, so we will see. I certainly do not want this to be exploited by too many people.
However, the theory itself can be applied in many different ways, so there are many permutations of reversion that you can apply to your trading. I also believe that hedge funds and the like apply reversion-type principles. I know they apply fluid dynamics to their systems, and what I’m describing isn’t too different.
I will see if we can get a few more of the old Penguins to join the conversation, and I will share more. I only sent the email to 100 users yesterday so today I will send to a few hundred more

Focus, Patience, Determination & Order in chaos
September 1, 2024 at 3:13 pm #15717Perhaps I need to show something to get the conversation started.
I’m showcasing two types of reversion in this example. Can you spot them?

I’m using an indicator I made for TradingView to spot reversion areas here.
Attachments:
You must be logged in to view attached files.Focus, Patience, Determination & Order in chaos
September 1, 2024 at 4:01 pm #15719Hi Saver0,
thanks for the invite. I joined your Beta. Very currious to see what you came up with.
I trade mostly gold (XAUUSD) so was hoping to see your system’s results for this asset. But looking over the dashboard I don’t see it. Is it only available in the paid subscription plan?Anyway, great job with this project. Will follow closely.
Vlan
September 2, 2024 at 12:43 pm #15720I’m curious how this restart will develop. Coincides with my personal restart to FX.
Interesting!A good trader is a realist who wants to grab a chunk from the body of a trend, leaving top- and bottom-fishing to people on an ego trip. (Dr. Alexander Elder)
September 2, 2024 at 8:05 pm #15721Hi Vlan,
Welcome back!
I just activated XAUUSD and got very good results. For the best results, make sure to look at the long-only option. You probably want to take only long signals. I expect experienced human traders to beat the results on the dashboard, so I’m hoping the users on this forum will have remarkable results.
Please take a look and let me know what you think.
Focus, Patience, Determination & Order in chaos
September 2, 2024 at 8:10 pm #15722I’m curious how this restart will develop. Coincides with my personal restart to FX.
Interesting!Hi Simplex!
Welcome back! I’m committed to keeping this going this time. I invested way too much time over the past three years to stop now. I believe reversion is the only edge we have and need to be highly successful. I also have a TradingView indicator that I want to share with this group. You can use it in day trading to detect these high-probability reversion zones.
The interesting thing about where we left off a few years back is that everything moved into TradingView. Unfortunately, I don’t think it’s in our best interest, but it at least simplifies some things. There are pros and cons, I guess.
Focus, Patience, Determination & Order in chaos
September 3, 2024 at 7:22 am #15727Thanks for adding it

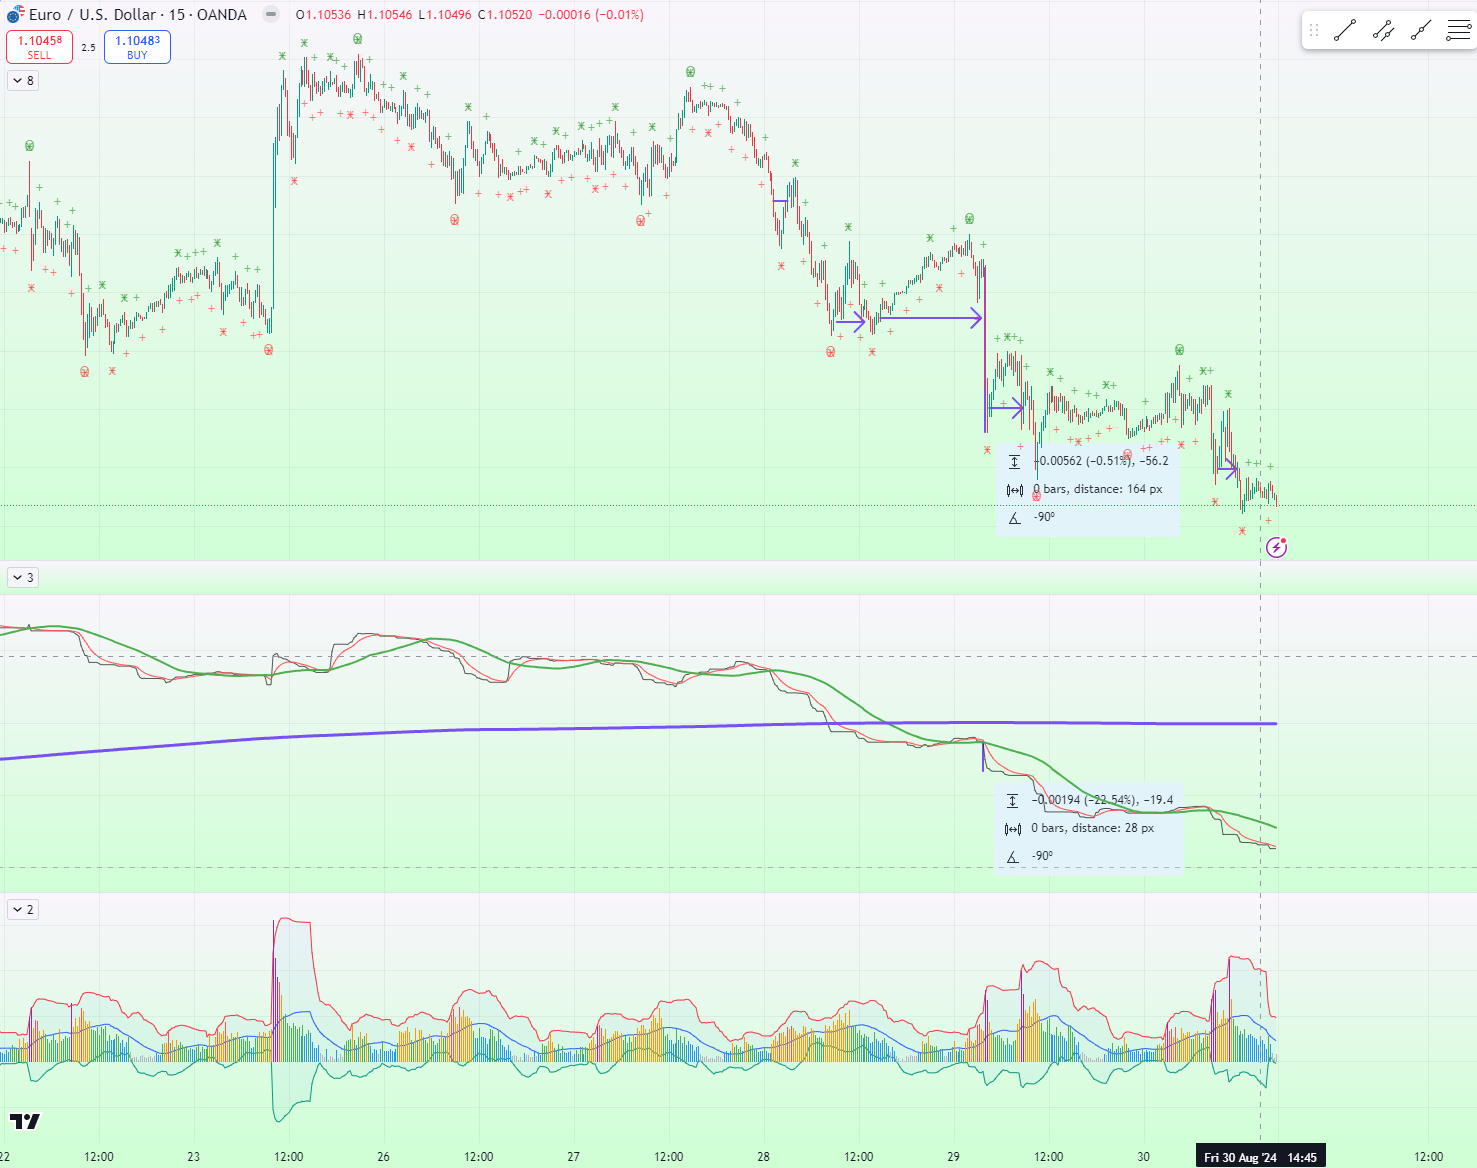
I made a post to the product improvement thread as not to clutter this one.As to your question about two types of reversion… just from looking at the posted chart I would say one type is slow and the other one is fast? Comparing time it took price to move away vs time it took it to come back?
September 3, 2024 at 9:48 am #15729Good observation! Time is still a key component that I haven’t cracked statistically. I’ve been told that there is a time window for reversions. My system currently uses an arbitrary time window but not a window calculated based on the price movement or candle(s). So I appreciate your comment and perhaps there is something we can develop here.
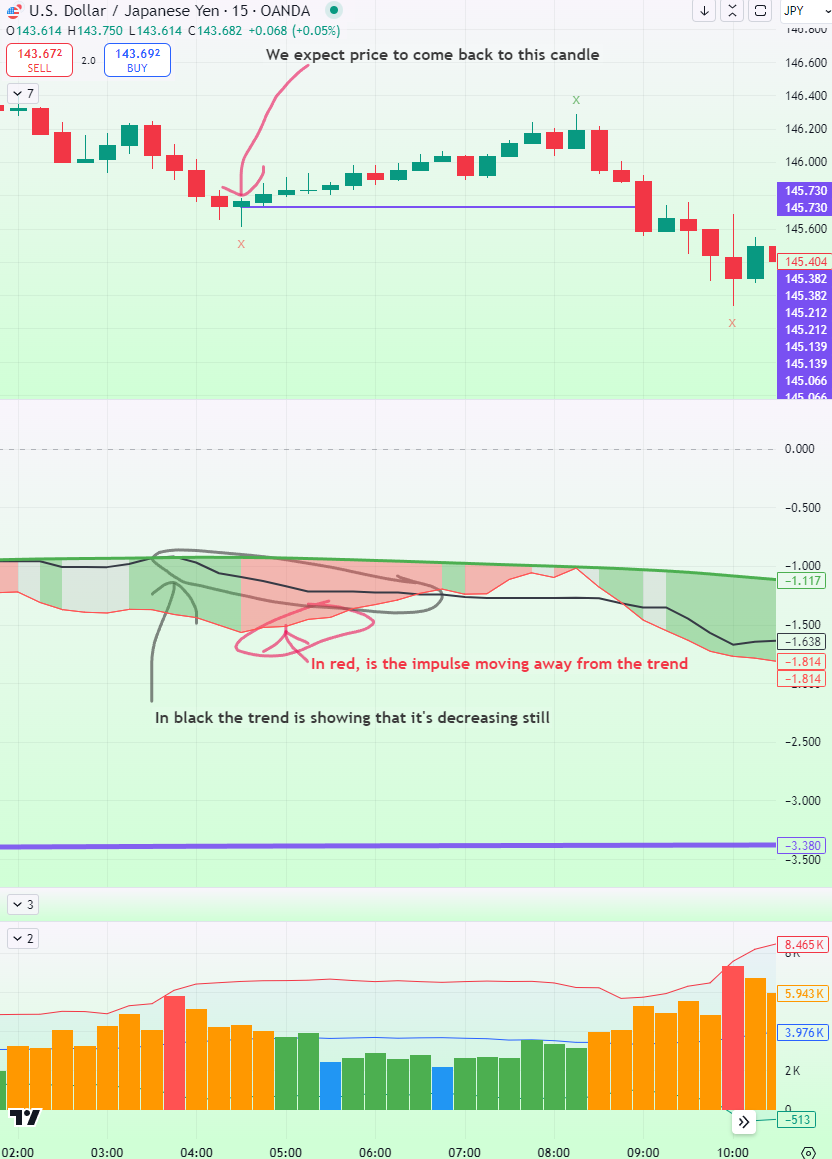
One of the types that I was getting at is the primary type, which is the easiest to detect and happens when the price moves away from the trend. This, I believe, is what experienced trend traders trade. Many use just the candle sticks, but some use simple indicators like MAs, MACDs, etc. However, in my case, I built an indicator specifically for detecting trends and impulses against a trend. Also, keep in mind that impulses against a trend are what eventually lead to the change in trend as well.
In this example, you can see the purple line I highlighted on the indicator showing -12pips down movement in trend while price prints an impulse of +32pips. This is a key reversion zone, and we would expect if not all, that most of that move to revert back to the candle from which the price started to move away.

This indicator doesn’t paint, by the way.
I will wait and see if someone can figure out what the second type is
-
This reply was modified 1 year, 10 months ago by Saver0.
Attachments:
You must be logged in to view attached files.Focus, Patience, Determination & Order in chaos
September 3, 2024 at 9:51 am #15731Here is a live one to demonstrate
Attachments:
You must be logged in to view attached files.Focus, Patience, Determination & Order in chaos
September 3, 2024 at 10:35 am #15733Thinking out loud, I hypothesize that type 1 is price-action driven reversion and type 2 is indicator driven reversion. (Granting that ‘price-action’ in the form of candles is its own type of indicator, drawing OHLC price locations within periods of time, so we are ~technically~ seeking confluence between two or more indicators in that moment.)
Are the colored arrow-lines auto-generated, or are you drawing those on the chart to illustrate for us?
Why are there only colored lines on the right side of the chart, not the left?
Are you specifically directing our attention to the vertical blue lines on the 29th, not any of the horizontal lines? (Seems likely, since that is indeed “finding confluence between two indicators in that moment,” as I said.)Would trades be entered every time the horizontal arrow lines are broken, or only when a break is paired with a confluence of at least two vertical lines indicating significant price movement?
September 3, 2024 at 5:05 pm #15734Thinking out loud, I hypothesize that type 1 is …
A bit of hypothesizing can be fun from time to time, but to start a good discussion on the topic some more information about the system would come in handy. A bunch of pics is quite weak to provide a good foundation for improvements or at least understanding how everything is supposed to work.
Just my 5 cents for the moment.

A good trader is a realist who wants to grab a chunk from the body of a trend, leaving top- and bottom-fishing to people on an ego trip. (Dr. Alexander Elder)
September 3, 2024 at 6:28 pm #15735Maybe gg53’s ghost is possessing him for a joy-ride.

(Now, Saver, you get to know how Gadi felt while trying to explain fractal arrow prediction without explaining fractal arrow prediction!)I’ll just settle in and be an Active Listener in the meantime, maybe try to recreate the scene as best as I can with my free TV account (I’ll buy a year of Premium as soon as the Black Friday Sale starts, but that’s a few months away yet).
I certainly don’t have the custom indicator that draws a box showing the bars, distance, and degrees. I don’t think that I would have personally trusted a correlation between gaps in squiggly-mean indicators prognosticating a price action reversion on the bar charts, but I guess that’s where you step in and start calculating the actual Clear Rates over time. Salute to Doing the Math.Attachments:
You must be logged in to view attached files.September 4, 2024 at 5:49 am #15737Maybe gg53’s ghost is possessing him for a joy-ride.
(Now, Saver, you get to know how Gadi felt while trying to explain fractal arrow prediction without explaining fractal arrow prediction!)
A good trader is a realist who wants to grab a chunk from the body of a trend, leaving top- and bottom-fishing to people on an ego trip. (Dr. Alexander Elder)
September 4, 2024 at 8:26 pm #15739Are the colored arrow-lines auto-generated, or are you drawing those on the chart to illustrate for us?
Why are there only colored lines on the right side of the chart, not the left?
Are you specifically directing our attention to the vertical blue lines on the 29th, not any of the horizontal lines? (Seems likely, since that is indeed “finding confluence between two indicators in that moment,” as I said.)Are the colored arrow-lines auto-generated, or are you drawing those on the chart to illustrate for us?
Just some of the zones I drew to illustrateWhy are there only colored lines on the right side of the chart, not the left?
I drew only a coupleAre you specifically directing our attention to the vertical blue lines on the 29th, not any of the horizontal lines? (Seems likely, since that is indeed “finding confluence between two indicators in that moment,” as I said.)
Yes, its the trend lines in purple that I drew on the 29th on the candlestick chart and on the indicator itself.Focus, Patience, Determination & Order in chaos
September 4, 2024 at 8:35 pm #15740
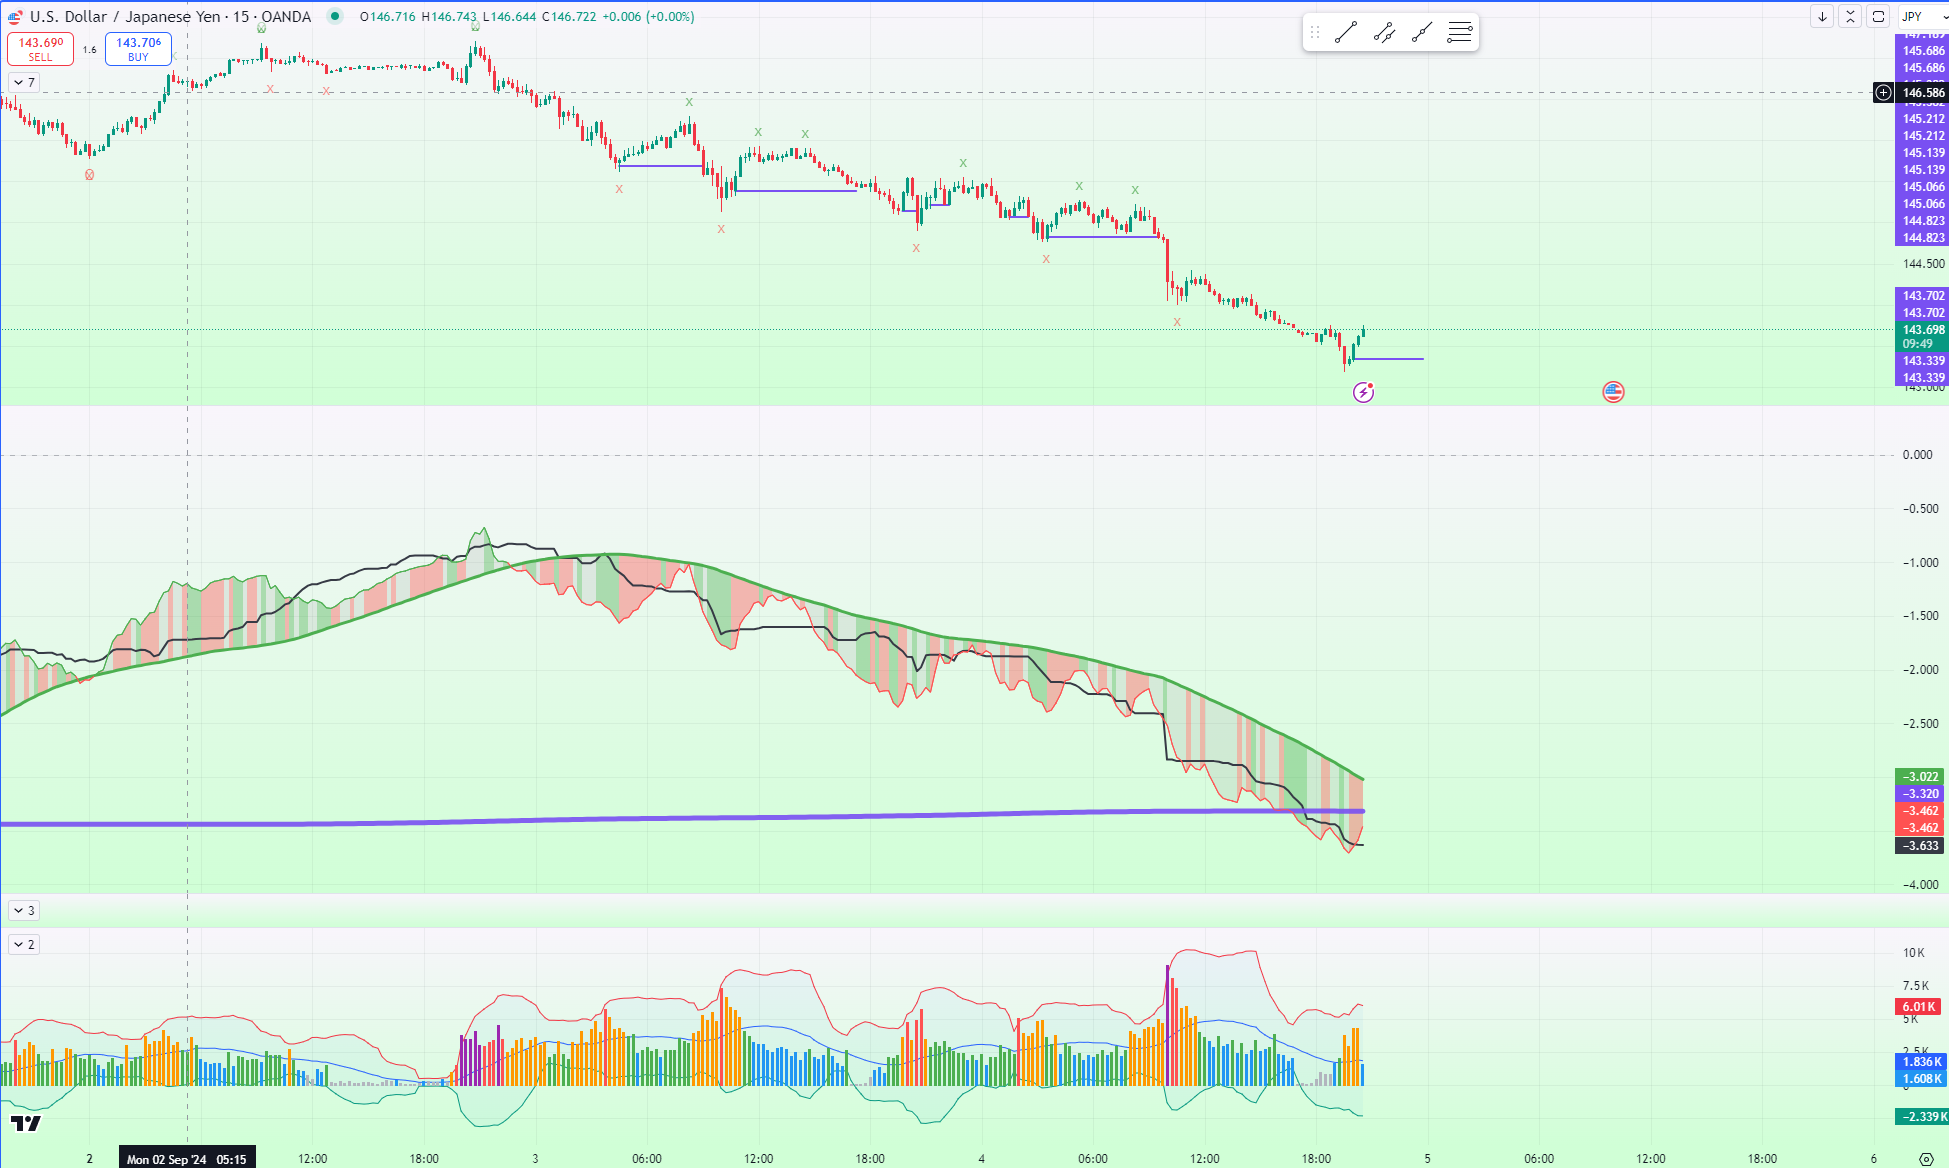
I refined the indicator I created specifically for TradingView by applying the Impulse reversion theory I use in the main trading system in Market Oracle. Unfortunately, that cannot be done in TradingView because of manycomplex computations and the optimizations it runs.
I wanted to come up with a simple indicator that we can use to capture the essence of the theory. I want to show you guys that you can trade these impulses back into trend. In the above chart of USDJPY 15Min, I have the updated version of the Impulse Reversion indicator that makes it easier to spot the change in price and the trend. Before, you had to look at the candles to see where the price was going, and you got the trend off of the indicator. Now, it’s all next to each other, and where they are inverted, we see it with red/green indicating the type of trade that should bring price to that zone area.
I added some annotations to make it easier to understand here.

Attachments:
You must be logged in to view attached files.Focus, Patience, Determination & Order in chaos
September 4, 2024 at 8:42 pm #15742Yes, its the trend lines in purple that I drew on the 29th on the candlestick chart and on the indicator itself.
Okay, then; monkey-see-monkey-do, I have drawn yellow lines on the left side of that chart, where I think the divergence/imbalance moments occur that lead to a Reversion Zone. Something like this, yeah?
Attachments:
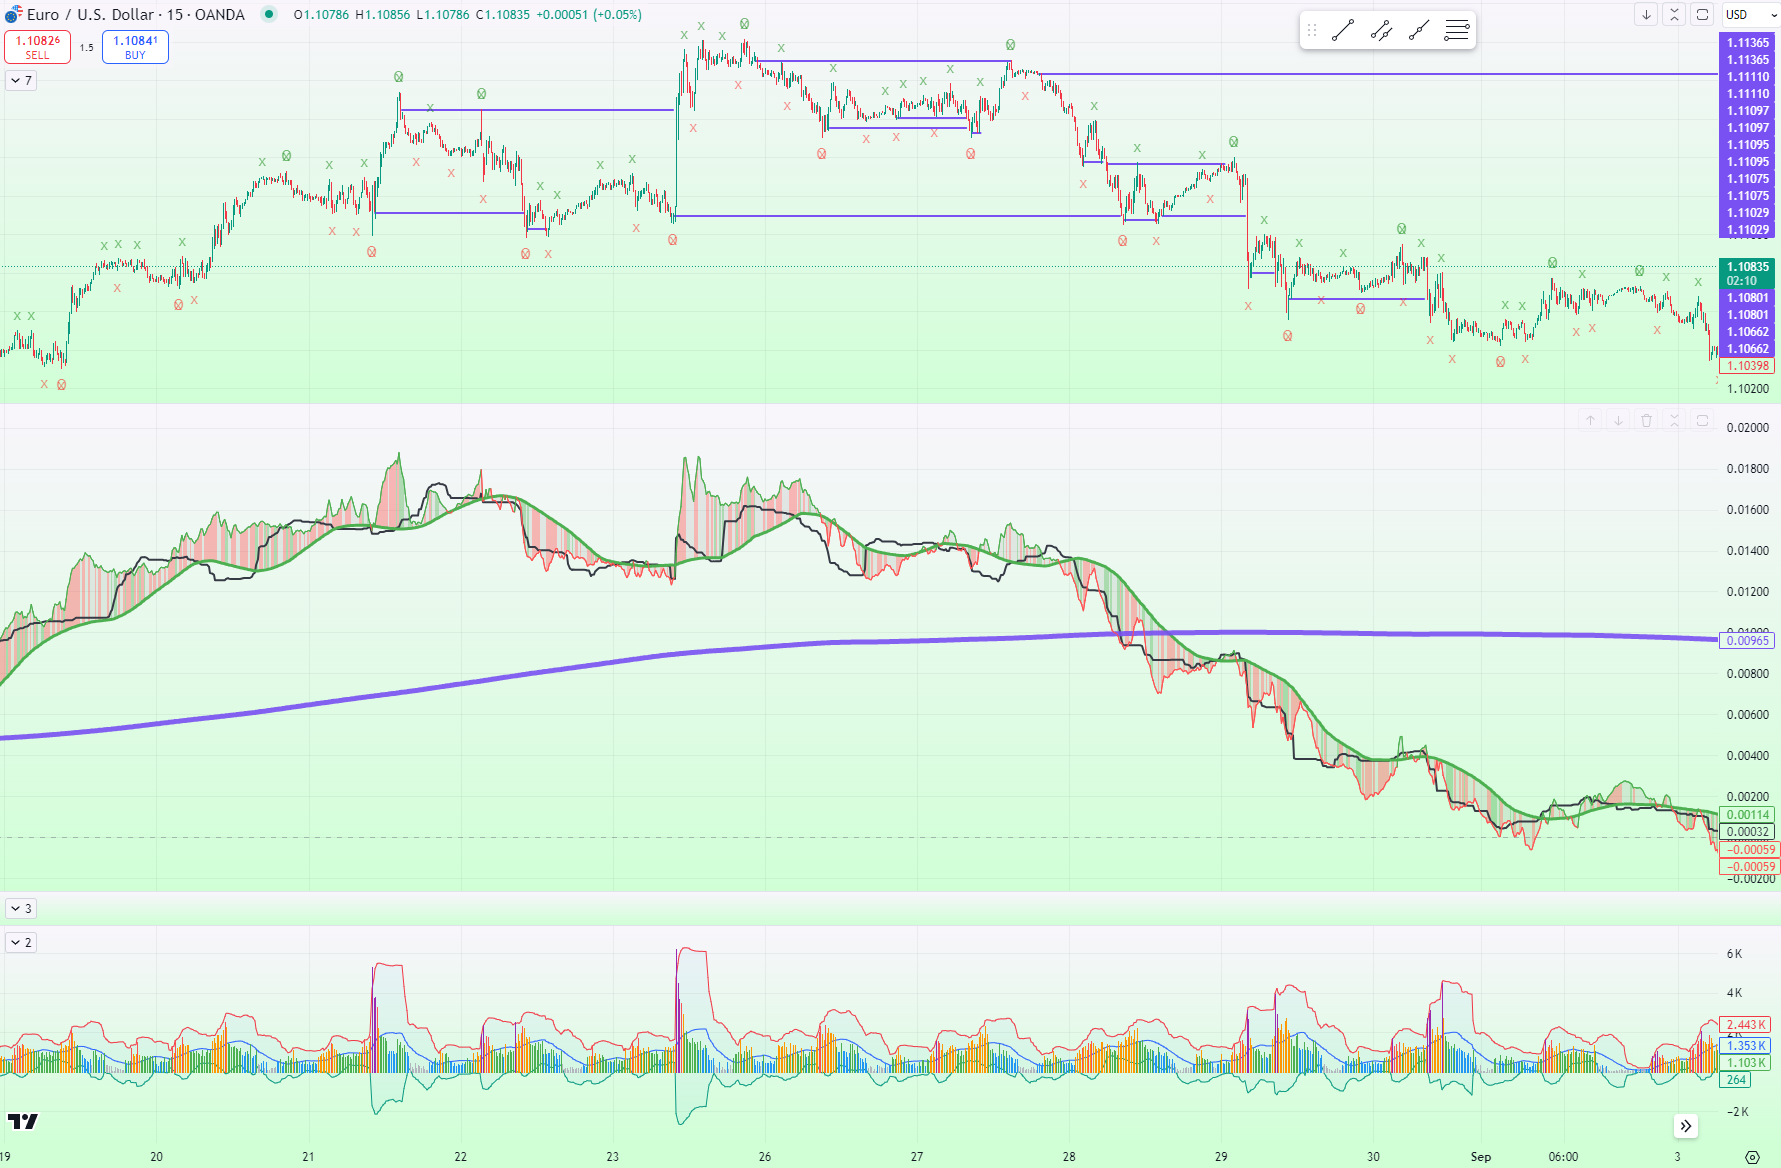
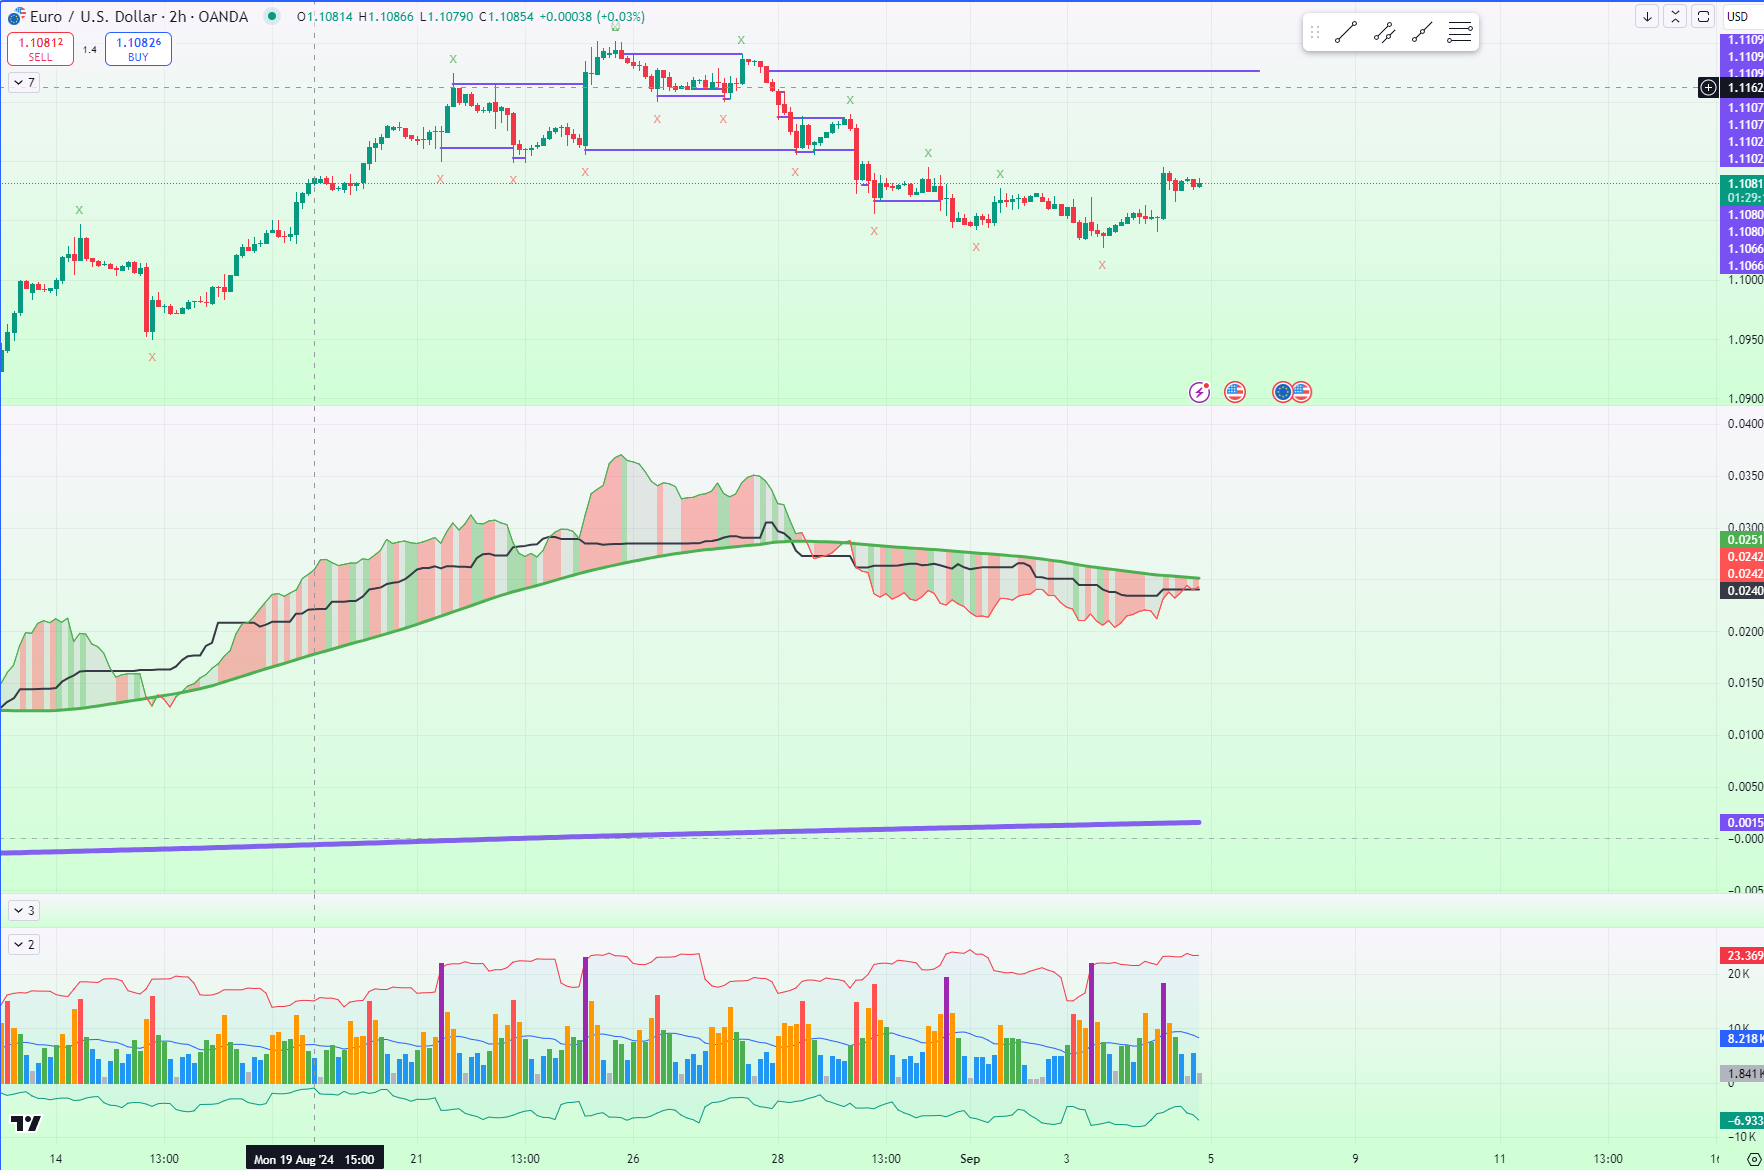
You must be logged in to view attached files.September 4, 2024 at 9:28 pm #15745I will publish the new version of the indicator tomorrow, and you should get it through TradingView then. It makes spotting these easier. I think the best zones are validated with 2 time periods, but just looking at the M15 on EURUSD, I get this.

After looking at the upper zone in H2, it would look like this and most likely where the price is going. Since it’s a higher time period zone, it takes longer to complete the cycle.

-
This reply was modified 1 year, 10 months ago by Saver0.
-
This reply was modified 1 year, 10 months ago by Saver0.
Attachments:
You must be logged in to view attached files.Focus, Patience, Determination & Order in chaos
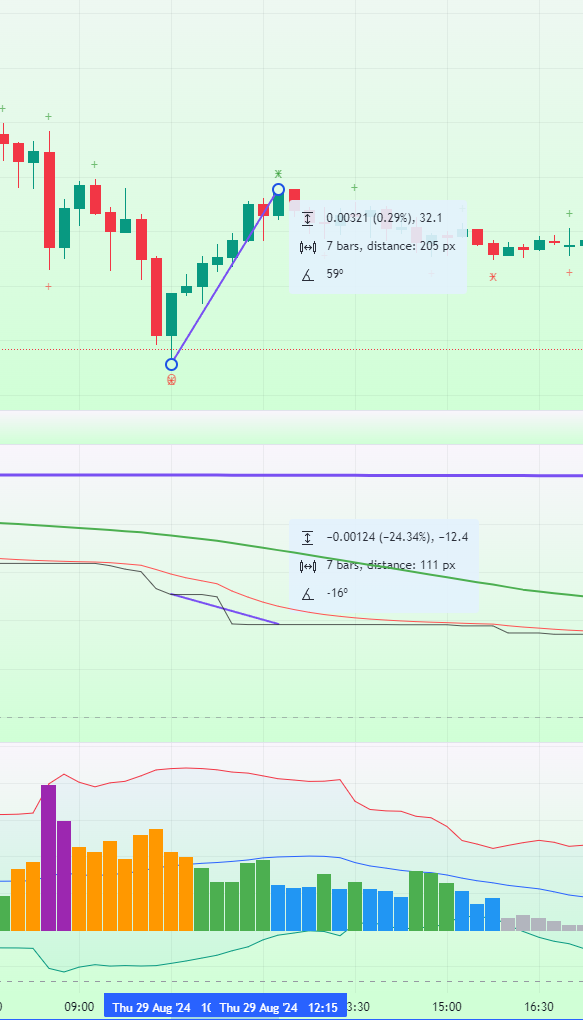
September 4, 2024 at 10:17 pm #15750After looking at the upper zone in H2, it would look like this and most likely where the price is going.
If I follow the same rules I was using in my post above, I only really see one valid zone in the recent examples.
Highlighted with vertical lines that I drew in myself: Significant spike of price action on the bar chart, with a severe angle deviation of the fast line in the indicator window, while also being above the slow median line, although I’m not yet sure whether that is a key confirmation rule. Edit: Oh, and I have cropped it out, but there was also a colored spike on the volume indicator, which does appear to be one of the confirmation rules.
On that timeframe I would feel compelled to disregard the other horizontal lines because they are not connected to strong enough movements of price. (But please do help me understand why/when/where I’m wrong in doing that!)-
This reply was modified 1 year, 10 months ago by GildedLining.
Attachments:
You must be logged in to view attached files.September 5, 2024 at 4:18 am #15754The second type I would say is when price moves in the direction of the trend but much faster relative to it’s previous movement. Like when breaking through a “support’, dropping quickly down and then retracing back up.
Attachments:
You must be logged in to view attached files.September 5, 2024 at 11:46 am #15756After looking at the upper zone in H2, it would look like this and most likely where the price is going.
If I follow the same rules I was using in my post above, I only really see one valid zone in the recent examples.
Highlighted with vertical lines that I drew in myself: Significant spike of price action on the bar chart, with a severe angle deviation of the fast line in the indicator window, while also being above the slow median line, although I’m not yet sure whether that is a key confirmation rule. Edit: Oh, and I have cropped it out, but there was also a colored spike on the volume indicator, which does appear to be one of the confirmation rules.
On that timeframe I would feel compelled to disregard the other horizontal lines because they are not connected to strong enough movements of price. (But please do help me understand why/when/where I’m wrong in doing that!)You are correct in identifying the candle where you saw the price moving quickly away from the trend. These are impulses that often gets corrected.
Keep in mind that every candle can be treated individually. So, if the candle is a spike against the trend, we can expect the price to revisit back to some area within that candle. This is how there are many many impulse zones within a short number of candles. This inhrently is what drives price, this act of rebalancing itself.
You can think of what happens when large buy orders come in: it moves the price up and takes it off of balance. People see an opportunity to adjust that imbalance, and then the price comes down. It is an efficient market, so everything moves in balance.The second type I would say is when price moves in the direction of the trend but much faster relative to it’s previous movement. Like when breaking through a “support’, dropping quickly down and then retracing back up.
This is a great observation @VlanFX. Yes this is one but I put that also in Type 1. Type 1 is any impulse away from the trend will be retraced back into trend.
I can give the answer to type 2 if you like. At least my definition of it.
Focus, Patience, Determination & Order in chaos
September 8, 2024 at 3:49 pm #15758I can give the answer to type 2 if you like. At least my definition of it.
Yes, please do.
September 9, 2024 at 3:03 am #15759I will publish the new version of the indicator tomorrow, and you should get it through TradingView then. It makes spotting these easier. I think the best zones are validated with 2 time periods, but just looking at the M15 on EURUSD, I get this.
How might I access the indicator? I don’t see any published scripts on your TV profile.
Now, it’s all next to each other, and where they are inverted, we see it with red/green indicating the type of trade that should bring price to that zone area.
I added some annotations to make it easier to understand here.
To be clear in my understanding, “where they are inverted, we see it with red/green indicating the type of trade that should bring price to that zone” means that bullish trades are when the black Fast Trend line crosses into a range between the thin green Fast Impulse line sloping downward toward the thick green Slow Impulse line, and then bearish trades are vice versa, seeking the red Fast Impulse line sloping upward toward the (still green) Slow Impulse line.
And this is evidently still valid even without the price action + volume trade setups that I’ve written about earlier — so I take it that this is a “type 2” Reversion Zone setup.September 10, 2024 at 10:16 am #15760Hey everyone,
Let’s break this down so it’s super clear.
There are 3 key lines we’re working with:
Black: This is your Price Trend line.
Green: Fast Moving Average (MA) of the Price Trend line.
Purple: Slow MA of the Price Trend line.
Red/Green line (with matching background color): This is your Price Impulse line.Type 1: Inversion Setup
When the Trend line shows one direction but the Impulse line is going the opposite way, that’s your signal. You’ll notice there’s a shaded background area between the Green Fast MA and the Impulse. This highlights the expected price reversion. The exact price target could be the midpoint of the candle.Type 2: Relative Distance Setup
This one’s a bit trickier to spot but it’s still very effective. It’s based on the relative distance between the Impulse or Price and the Trend. For example, if the Trend line shows a $50 move between point A and point B, but the price itself moved $80 in that same time, we’d expect a reversion of at least -$30. It’s all about catching that difference.Type 3: Long-Term Reversion Setup
This works on longer cycles. When the Price Trend line crosses over the Fast (green) or Slow (purple) MA, we’re expecting the price to eventually return to that level after a longer time period. Keep an eye out for this—it’s another powerful reversion signal.New Feature Alert:
I’m also excited to announce that I’m wrapped up a new algorithm that detects pump-and-dump schemes for alt-coins with a 90%+ success rate. It’s in the final stages and will be available in production soon. Once it’s live, I’ll create clear tutorials to guide you through this new indicator and the pump-dump interface. The new indicator will then be released as part of any paid subscription.Focus, Patience, Determination & Order in chaos
-
This reply was modified 1 year, 10 months ago by
- AuthorPosts
- You must be logged in to reply to this topic.