› Forums › General Discussions › MTH – Having Fun with Geometrical Charting
Tagged: Angles, Chart, Geometrical, MT4, MTH, Naked Trading, Projection
- This topic has 18 replies, 10 voices, and was last updated 11 years ago by
 centuripe.

- AuthorPosts
- January 19, 2015 at 8:41 pm #4240
Disclaimer and Warning.
==================================================================================
1. All of my share here is for educational purpose only.
2. All tools or systems share here ‘freely’ as is and with your own risk.
3. Past performance could not guarantee future result.
4. If sometimes in the future, someone contact you by e-mail or Private Messages or by other way of communications and acting or pretending like me, and asking for help and/or requesting money for any reason. Please IGNORE IT immediately.. and please post your finding / inform our forum admin.
===================================================================================
Hi Guys, I promise to some of our Brothers and Sisters to discuss about Geometrical Charting.., Btw this is my own interpretation of how to implementing Geometrical charting and use it to analyze price movement and projecting the future movement. Yes, it is not about guessing or predicting but only projecting.
But, I found difficulty on how to ‘presenting’ this style of analysis and not so easy to explain using only pictures or text explanations , so i try to learn to create video about it.. lol.
This is my first video, (first time uploading to youtube too..hahaha).. and please forgive me there’s no voice.. only music (my microphone broken..lol)..
Well Enjoy and feel free to contribute..
Best Regards
MTH
-
This topic was modified 11 years, 8 months ago by MTH2014.
Intuition, Experiences and Common sense..
http://www.binaryoptionsedge.com/January 19, 2015 at 9:48 pm #4242Thank brother. I will have to study this. Does this work with H4?
January 19, 2015 at 9:53 pm #4243Thank brother. I will have to study this. Does this work with H4?
Hi Brother, Yes Geometrical charting could work with any TF.. since is not about ‘time’ in term of ‘minutes, hours, etc’ but ‘time’ in term of ‘space’ ‘angles’ ‘vibrations’ and ‘cycles’
Best Regards
MTH
Intuition, Experiences and Common sense..
http://www.binaryoptionsedge.com/January 19, 2015 at 10:15 pm #4245What a video

Chart setup is a mystery. where do you get or should there be 13.5p and 24 boxes?
Third trendline, where do you get 315?
From what comes 4th trendline?
Can first + second TL equal to more than 360 degrees?
Hope you don’t mind my questions
 January 19, 2015 at 11:39 pm #4246
What a video
Chart setup is a mystery. where do you get or should there be 13.5p and 24 boxes? Third trendline, where do you get 315? From what comes 4th trendline? Can first + second TL equal to more than 360 degrees? Hope you don’t mind my questions Hi Brother,
Yes, 13.5 point is something that rarely exposed in public..lol. this is the smallest price block.. You may not believe me but this is universal to all instruments /Pairs. If you keep repeating this smallest range as a levels and count it from parity to north and south, in all pairs you will arrive at highest and lowest of the pairs. Try it to USDCHF with that previous gigantic spike just divide from parity to south with 1350 point step (13.5 x 100) you will arrive at where the chf surge stop.. and turn around.
And about 24 grids is not necessary 24 it’s depend on your MT4 and screen resolution, the range could be 20 to 30 boxes. As long as there’s no half box then it’s fine..
The ‘Angles’. Actually there’s only 2 ‘real’ trend directions.. diagonal up is 45 degrees and diagonal down is 315 degrees, and the rest is just distortion and will be back to their ‘real’ direction..
‘Ricochet’ corner can’t be higher than 360 degrees because total angles of triangle will always 360 degrees.
So, 45 and 315 are the core of geometrical charting and use to adding or subtracting ‘other’ angles. You can see in my video that 1st Trend Line diagonal down is to extreme (not 315 degree) so it will get ‘vibrating’ reaction with the direction of 2nd Trend Line that goes diagonal up with similar extreme angle (not 45 degree), this two momentum should neutralize with the 3rd Trend Line so the price movement ‘follow’ this 3rd Trend Line angle until met the ‘real’ angle of 45 degree.
Here is the calculation;
1st TL = 280.8 degree (diagonal down), 2nd TL = 78.2 degree (diagonal up) 3rd TL = 280.8 + 78.2 = 354 degree (correctional angle). this 3 angles create ‘triangle’.
But’ the ‘real’ diagonal down angle is 315 so the counterpart of 354 degree is 354-315 = 39 degree (the 4th TL) and this angle will pointing next move up after correctional angle price movement
Hope it help and best regards
MTH
Intuition, Experiences and Common sense..
http://www.binaryoptionsedge.com/January 20, 2015 at 12:18 am #4248Thanks, Kiads! Top explanation, I’m gonna draw them now, good exercise before snore time
 January 20, 2015 at 9:28 am #4261
Hi Guys, Another example video of having fun with Geometrical Charting – Basic Angles of 45° and 315°
Enjoy
MTH
Intuition, Experiences and Common sense..
http://www.binaryoptionsedge.com/January 21, 2015 at 10:14 am #4334Thanks for the great videos. Keep them coming ;)
How do you came up with this use of angles? Is there some readings that you can recommend?
"A dream you dream alone is only a dream. A dream you dream together is a reality." (John Lennon)
January 21, 2015 at 10:08 pm #4349Can’t cope with your all work and ideas. Keep it up bro
 January 21, 2015 at 11:17 pm #4352
Hi Kiads, you’re hard to get in touch
I want to harass you with some details if you don’t mind. The second video is the source!
- Is first TL drawn from top to top or bottom to top?
- Are the horizontal lines the price projections?
If I can these 2 sorted at first, then I get a clearer understanding to build on, thank you!
January 22, 2015 at 4:45 am #4356Hi Kiads, you’re hard to get in touch
I want to harass you with some details if you don’t mind. The second video is the source!- Is first TL drawn from top to top or bottom to top?
- Are the horizontal lines the price projections?
If I can these 2 sorted at first, then I get a clearer understanding to build on, thank you!
Hi Brother, sorry for late reply.. hopefully this picture could answered your questions..

Hope it help and best regards
MTH
Intuition, Experiences and Common sense..
http://www.binaryoptionsedge.com/January 22, 2015 at 4:01 pm #4369Thanks, Kiads!
January 27, 2015 at 11:01 am #4469Hi Kiads,
My first post here. Thanks for all your contributions and also for starting a thread on geometrical charting – one of my favorites.
February 21, 2015 at 7:50 pm #4958Great videos, thanks a lot Kiads
March 7, 2015 at 3:15 pm #5429Hi Guys, I promise to some of our Brothers and Sisters to discuss about Geometrical Charting.., Btw this is my own interpretation of how to implementing Geometrical charting and use it to analyze price movement and projecting the future movement. Yes, it is not about guessing or predicting but only projecting. But, I found difficulty on how to ‘presenting’ this style of analysis and not so easy to explain using only pictures or text explanations , so i try to learn to create video about it.. lol. This is my first video, (first time uploading to youtube too..hahaha).. and please forgive me there’s no voice.. only music (my microphone broken..lol).. Well Enjoy and feel free to contribute.. Best Regards MTH
Dear Kiads,
As far as I could see, entry is crucial in this method. How do you choose the first TL to start the process?
Best regards..
Nothing has ever motivated me more than this...
March 7, 2015 at 3:32 pm #5431Hi Guys, I promise to some of our Brothers and Sisters to discuss about Geometrical Charting.., Btw this is my own interpretation of how to implementing Geometrical charting and use it to analyze price movement and projecting the future movement. Yes, it is not about guessing or predicting but only projecting. But, I found difficulty on how to ‘presenting’ this style of analysis and not so easy to explain using only pictures or text explanations , so i try to learn to create video about it.. lol. This is my first video, (first time uploading to youtube too..hahaha).. and please forgive me there’s no voice.. only music (my microphone broken..lol).. Well Enjoy and feel free to contribute.. Best Regards MTH
Dear Kiads, As far as I could see, entry is crucial in this method. How do you choose the first TL to start the process? Best regards..
Hi Brother, of course by looking at previous wave highest or lowest that already fixed. This Geometrical Charting concept need a lot of screen time to practice, please forgive me that i still don’t have time to create new videos to continue the explanation about next steps..
Best Regards
MTH
Intuition, Experiences and Common sense..
http://www.binaryoptionsedge.com/March 11, 2015 at 3:58 pm #5679Hi Kiads,
Been on vacation and catching up on things. Love the concept in the post. Looking forward to more videos!
July 7, 2015 at 6:56 pm #7267has anybody got a clue here , That could help me to use this tool ?
I love it but only half understand it atm.
I AM That I AM
September 23, 2015 at 9:47 pm #7993Hi everyone,
Would like to know if someone could explain me how to get this 13.5 point box ? I thought it was by adding 3240 to the minimum of the fix scale but after sevral trials I didn’t manage to try the angle as our friend MTH.
Thanks for your help
-
This topic was modified 11 years, 8 months ago by
- AuthorPosts





 Chart setup is a mystery. where do you get or should there be 13.5p and 24 boxes? Third trendline, where do you get 315? From what comes 4th trendline? Can first + second TL equal to more than 360 degrees? Hope you don’t mind my questions


 I want to harass you with some details if you don’t mind. The second video is the source!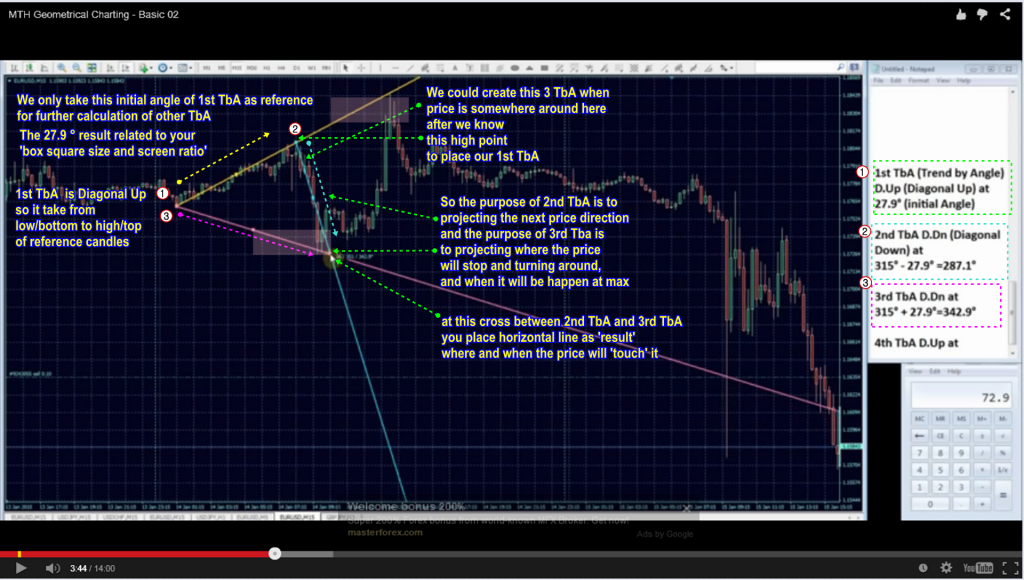




- You must be logged in to reply to this topic.