› Forums › Indicator discussion › MTH – Sergio Borsani Indicators (must have)
This topic has been reported for inappropriate content
Tagged: Candles, Harmonic Patterns, indicator, Market Profile, Mini Charts, MTH, Overlays, Sergio Borsani
- This topic has 89 replies, 17 voices, and was last updated 7 years, 3 months ago by
 Hollywood The Trade King.
- AuthorPosts
- January 16, 2015 at 11:08 pm #4148
Hi Sergio
 ,
,WPR is Williams % range.
cheers
hannele
January 17, 2015 at 12:58 am #4152Hi Sergio
, WPR is Williams % range. cheers hanneleHi Hannelle
Ups! Ok, WPR is William % Range, respect to the original cuestion, not know what to say, I’m off topic, too many things on my mind.
I just know that I know nothing.
Best regards
Sergio
My apologies, my biggest limitation: write in English
January 17, 2015 at 12:02 pm #4163Thanks to Mr Sergio Borsani and also to my teacher Mr Kiads!
may i ask what is the use of Profile Market indi and how it could help us in trading?
Thankyou
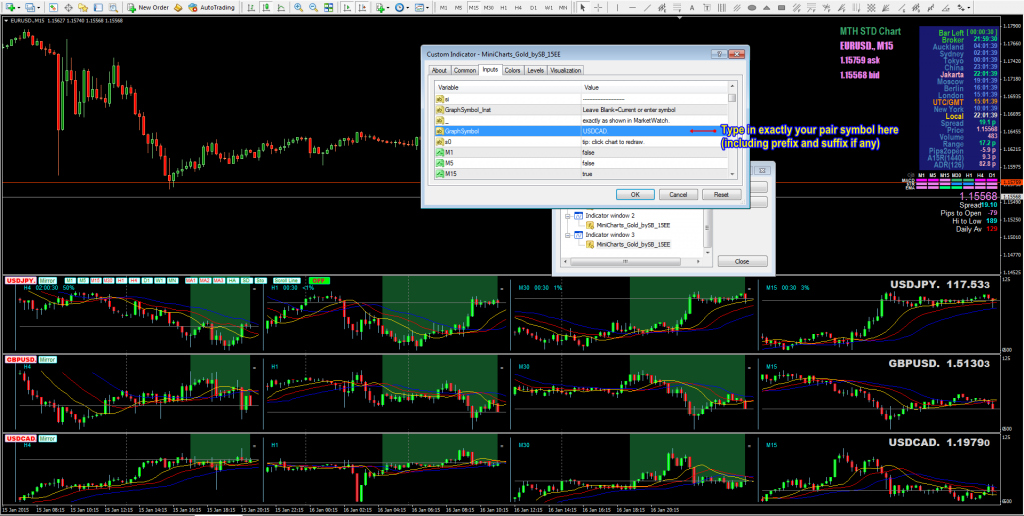
January 17, 2015 at 1:54 pm #4168hi sir can the two different pairs be overlayed on the mini chart because I have tried by it seem it cant be overlayed
January 17, 2015 at 3:12 pm #4169hi sir can the two different pairs be overlayed on the mini chart because I have tried by it seem it cant be overlayed
Hi Brother, Yes it can just try again and type in your pair symbols exactly including prefix and suffix if any..

Hope it help and best regards
MTH
Intuition, Experiences and Common sense..
http://www.binaryoptionsedge.com/January 17, 2015 at 3:24 pm #4170hi sir can the two different pairs be overlayed on the mini chart because I have tried by it seem it cant be overlayed
Hi Brother, Yes it can just try again and type in your pair symbols exactly including prefix and suffix if any..
Hope it help and best regards MTHbrother I meant instead of it being scattered only one subwindow for two different pairs overlayed together..
to Sergio thank you very much for the 5th dimension indicator have you guys notice how pretty it shows divergence is fabulous brother very unique never seen something like it divergence on the spot wow.something else did you right this 1,2,3,4 numbers on the chart manual or is done automatically by the 5th dimension indicator.if yes is automatically indicated by the indi mine doesn’t show the numbers
January 17, 2015 at 3:33 pm #4171Thanks to Mr Sergio Borsani and also to my teacher Mr Kiads! may i ask what is the use of Profile Market indi and how it could help us in trading? Thankyou
Hi Brother, Market Profile, is old tools from stock market designed by J.P. Steidlmayer. with the concept of Auction Market Theory.. , as far as I know this is different branch of Technical Analysis and is not easy at all to learn in just couple days.. , you can read basic term in wikipedia here : http://en.wikipedia.org/wiki/Market_profile
and there’s a lot of softwares and trading platform that represent market profile and also subjective concepts on how to use it, but I think maybe this video is more closer to you, because Dale Pinkert explain Market Profile in MT4 platform and using my friend creation of Market Profile (ay-Market Profile). which similar to MP from our Brother Sergio Borsani.
Hope it help and best regards.
MTH
Intuition, Experiences and Common sense..
http://www.binaryoptionsedge.com/January 17, 2015 at 5:02 pm #4172Hi Dear Kiads
Thankyou due to your kindly and generous reply about Market Profile! I am trying to learn about it via your hint!
a question about Mini Chart of Sergio :is it possible in mini chart we could have daily and H4 chart under each others?i tried but i couldnot setup it!
-
This reply was modified 11 years, 4 months ago by aryafx.
Attachments:
You must be logged in to view attached files.January 17, 2015 at 11:20 pm #4180hi sir can the two different pairs be overlayed on the mini chart because I have tried by it seem it cant be overlayed
Hi Brother, Yes it can just try again and type in your pair symbols exactly including prefix and suffix if any.. Hope it help and best regards MTH
brother I meant instead of it being scattered only one subwindow for two different pairs overlayed together.. to Sergio thank you very much for the 5th dimension indicator have you guys notice how pretty it shows divergence is fabulous brother very unique never seen something like it divergence on the spot wow.something else did you right this 1,2,3,4 numbers on the chart manual or is done automatically by the 5th dimension indicator.if yes is automatically indicated by the indi mine doesn’t show the numbers
Hi Fxrambo.
I now understand, brother not is possible overlaying each other, MiniCharts is only an indicator not a platform.
I’m glad you liked the 5thdimension and both the 1,2,3,4 numbers like the boxes were manually applied.
Now I’m working on a more adequate version, unfortunately we lose the MTF, too bad you can not have everything.
Sergio
My apologies, my biggest limitation: write in English
January 17, 2015 at 11:30 pm #4181Hi Dear Kiads Thankyou due to your kindly and generous reply about Market Profile! I am trying to learn about it via your hint! a question about Mini Chart of Sergio :is it possible in mini chart we could have daily and H4 chart under each others?i tried but i couldnot setup it!
Hi Ariafx, On the question regarding the MiniChart, unfortunately you can not, in other words, is not possible.
Sergio
My apologies, my biggest limitation: write in English
January 17, 2015 at 11:38 pm #4182Hi Brothers and Sisters,
In My Personal Opinion, even if you only use 1 Mini Charts by Sergio and load it to your favorite TF main chart, then activate the option like MA and Supply Demand and use TF let say from Daily to M1, and if you already understand how PA and market structure work, I believe you could trade in consistent profit.. as long as you obey your solid Money Management.. I don’t know why you should need so many options and indicators that actually in the core is pointing and calculating exactly same current condition.
As I explained before, you could just use naked candlestick chart to trade, or just line chart and single MA and could still profitable. So, please focus about what you want to learn seriously.. because being trading systems tourist just like running in circle you will always back to your starting point.
Best Regards
MTH
Intuition, Experiences and Common sense..
http://www.binaryoptionsedge.com/January 17, 2015 at 11:52 pm #4183Hi Kiads, fully agree with your opinion, could not have said it better.
Sergio
My apologies, my biggest limitation: write in English
January 18, 2015 at 3:25 am #4185it is an Gem experiment advise ! Thankyou Kiads
January 18, 2015 at 3:27 am #4186Hi Dear Kiads Thankyou due to your kindly and generous reply about Market Profile! I am trying to learn about it via your hint! a question about Mini Chart of Sergio :is it possible in mini chart we could have daily and H4 chart under each others?i tried but i couldnot setup it!
Hi Ariafx, On the question regarding the MiniChart, unfortunately you can not, in other words, is not possible. Sergio
Thankyou Sir! your effort and helping to other people is appreciated!
January 18, 2015 at 8:11 am #4187hi sir can the two different pairs be overlayed on the mini chart because I have tried by it seem it cant be overlayed
Hi Brother, Yes it can just try again and type in your pair symbols exactly including prefix and suffix if any.. Hope it help and best regards MTH
brother I meant instead of it being scattered only one subwindow for two different pairs overlayed together.. to Sergio thank you very much for the 5th dimension indicator have you guys notice how pretty it shows divergence is fabulous brother very unique never seen something like it divergence on the spot wow.something else did you right this 1,2,3,4 numbers on the chart manual or is done automatically by the 5th dimension indicator.if yes is automatically indicated by the indi mine doesn’t show the numbers
Hi Fxrambo. I now understand, brother not is possible overlaying each other, MiniCharts is only an indicator not a platform.
I’m glad you liked the 5thdimension and both the 1,2,3,4 numbers like the boxes were manually applied. Now I’m working on a more adequate version, unfortunately we lose the MTF, too bad you can not have everything. Sergiothank you Sergio am still testing the 5th dimension showing good results…I wish it was doing auto numbering of 1234 on the main chart but all in all is a good
January 18, 2015 at 8:47 am #4188Hi dear mates!
if there is any indicator of Multiple Stochastich of Rsi! I mean it is possible that we could see stochastic of Rsi indi of H4 and D1 under H1 chart price?
Thankyou
January 19, 2015 at 8:20 pm #4236Hi guis
Well, 5thDimension seems work now, totally new code whereby it is now 5thDimension_2.
Known issue:
This problem can occur only when you restart the platform.
When the leftmost candle on the story changes (due to update motivated for having reached the parameter Max Bars In History), the image on the indicator will move up or low in the scale, this implies that objects such as lines drawn on the indicator window seem to lose their anchor point (Not really happens, in indicators, the objects are anchored to the scale and not to the candles image).
To make both, image and scale, stable (at least for a while) you can draw a vertical line in the chart with name start5th where you wish 5thDimension_2 start the graph. You may change vertical line name by setting parameter StartVLineName. On each start the indicator will verify the position and inform you via an alert if the line has been left out of history.Image atached info:
The image is illustrative only and does not imply that I am suggesting any particular setting.
In chart
– SMA 50 Apply To HLCC/4
In subwindow 1
– 5thDimension_2 with InstanceID = 1, DataTypeInBuffer0 = 6 (HLCC/4)
– SMA 50 Apply To Previous Indicator’s Data
In subwindow 2
– 5thDimension_2 with InstanceID = 2, DataTypeInBuffer0 = 6 (HLCC/4)
– Bollinger Bands with Period = 50, Deviations = 2, Apply To Previous Indicator’s DataIndicator attached, if all goes well later I’ll upload it to my site.
Beta version, if you find a bug please let me know.Enjoy.
Sergio
Edit: Same archive in zip format added
-
This reply was modified 11 years, 4 months ago by Sergio Borsani. Reason: zip added
Attachments:
You must be logged in to view attached files.My apologies, my biggest limitation: write in English
January 19, 2015 at 9:12 pm #4241Hi guis Well, 5thDimension seems work now, totally new code whereby it is now 5thDimension_2. Known issue: This problem can occur only when you restart the platform. When the leftmost candle on the story changes (due to update motivated for having reached the parameter Max Bars In History), the image on the indicator will move up or low in the scale, this implies that objects such as lines drawn on the indicator window seem to lose their anchor point (Not really happens, in indicators, the objects are anchored to the scale and not to the candles image). To make both, image and scale, stable (at least for a while) you can draw a vertical line in the chart with name start5th where you wish 5thDimension_2 start the graph. You may change vertical line name by setting parameter StartVLineName. On each start the indicator will verify the position and inform you via an alert if the line has been left out of history. Image atached info: The image is illustrative only and does not imply that I am suggesting any particular setting. In chart – SMA 50 Apply To HLCC/4 In subwindow 1 – 5thDimension_2 with InstanceID = 1, DataTypeInBuffer0 = 6 (HLCC/4) – SMA 50 Apply To Previous Indicator’s Data In subwindow 2 – 5thDimension_2 with InstanceID = 2, DataTypeInBuffer0 = 6 (HLCC/4) – Bollinger Bands with Period = 50, Deviations = 2, Apply To Previous Indicator’s Data Indicator attached, if all goes well later I’ll upload it to my site. Beta version, if you find a bug please let me know. Enjoy. Sergio
Wow… Thank You So Much.. Brother.. Surely brilliant job.. that will help so many of us.. here.. I’m really glad to have Brother like You here..
I’ll try to find set up on how to use ‘her’ to make our trading better and will post here..
Once again Thank You and Best Regards
MTH
Intuition, Experiences and Common sense..
http://www.binaryoptionsedge.com/January 20, 2015 at 5:21 am #4255Hi guis Well, 5thDimension seems work now, totally new code whereby it is now 5thDimension_2. Known issue: This problem can occur only when you restart the platform. When the leftmost candle on the story changes (due to update motivated for having reached the parameter Max Bars In History), the image on the indicator will move up or low in the scale, this implies that objects such as lines drawn on the indicator window seem to lose their anchor point (Not really happens, in indicators, the objects are anchored to the scale and not to the candles image). To make both, image and scale, stable (at least for a while) you can draw a vertical line in the chart with name start5th where you wish 5thDimension_2 start the graph. You may change vertical line name by setting parameter StartVLineName. On each start the indicator will verify the position and inform you via an alert if the line has been left out of history. Image atached info: The image is illustrative only and does not imply that I am suggesting any particular setting. In chart – SMA 50 Apply To HLCC/4 In subwindow 1 – 5thDimension_2 with InstanceID = 1, DataTypeInBuffer0 = 6 (HLCC/4) – SMA 50 Apply To Previous Indicator’s Data In subwindow 2 – 5thDimension_2 with InstanceID = 2, DataTypeInBuffer0 = 6 (HLCC/4) – Bollinger Bands with Period = 50, Deviations = 2, Apply To Previous Indicator’s Data Indicator attached, if all goes well later I’ll upload it to my site. Beta version, if you find a bug please let me know. Enjoy. Sergio
hi Sergio id it possible to put the indicator in rar format I cant seem to download it.or have u updated it in your website
January 20, 2015 at 6:51 am #4256Sorry to bother dear brothers!
because i need attached indicator to work multi time may please if any of friends have a multi time of it ,help me to find it so!i want to have stochastic of Rsi indi of H4 and D1 under H1 chart price?


Thankyou
Attachments:
You must be logged in to view attached files.January 20, 2015 at 2:09 pm #4287Hi fxrambo
Zip archive added to post #4236 now, I hope the download goes well.
This is a beta version and I wanna be sure it works well before uploading to my site.Sergio
My apologies, my biggest limitation: write in English
January 21, 2015 at 5:16 am #4328Hi fxrambo Zip archive added to post #4236 now, I hope the download goes well. This is a beta version and I wanna be sure it works well before uploading to my site. Sergio
thank you Sergio now I can download it perfectly thank again…I don’t know why I cant download a normal file here unless is put into rar other website I can but here nope.thank you again now I have downloaded let me test it
January 28, 2015 at 9:10 pm #4493Hi all
MiniCharts Gold 15EG just uploaded to my site.
This version incorporates MACD main line, Relative Strength X and percentage change of pair on the day.
Enjoy
Sergio
My apologies, my biggest limitation: write in English
January 28, 2015 at 10:29 pm #4495Thank you Sergio
cheers
hannele
January 29, 2015 at 2:45 am #4501Hi all MiniCharts Gold 15EG just uploaded to my site. This version incorporates MACD main line, Relative Strength X and percentage change of pair on the day. Enjoy
Sergiohello , i saw ur indicators ..good work mate …but only problem i saw in ur web site is u not provide English language … try to add it too..

-
This reply was modified 11 years, 4 months ago by
- AuthorPosts
- You must be logged in to reply to this topic.