› Forums › Indicator discussion › MTH – Star Skull and Smiley Indicator (lite version)
Tagged: indicator, MT4, MTH, Star and Skull and Smiley, Sub Sequencer
- This topic has 126 replies, 43 voices, and was last updated 9 years, 10 months ago by
 hero447.
- AuthorPosts
- November 9, 2015 at 6:00 pm #8913
great to see you again kiads… ;) and thanks for your great indicator….
 November 10, 2015 at 12:46 am #8921
Good Local Morning.. lol, Thank You for all nice comments..
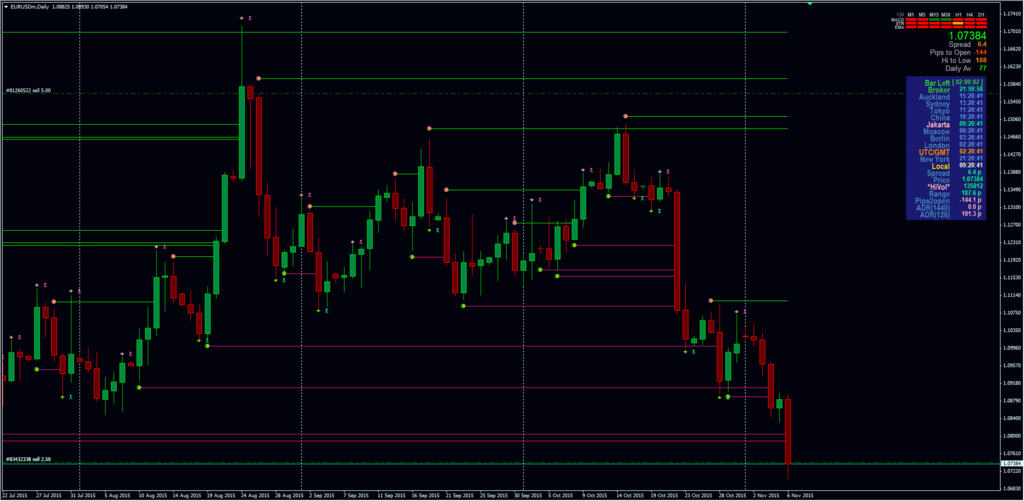
Hi Guys.. this Tuesday EU daily chart ( my broker with GMT 0) give us down sign.. so let see if today candle will become bearish candle.. lol.
Btw, this is example on how to look at her in general when i combined her with my 7ohlc indicator river (with high low option set to false).

Happy Trading and wish you all the best..

MTH
Intuition, Experiences and Common sense..
http://www.binaryoptionsedge.com/November 10, 2015 at 1:49 am #8922Hi Kiads….again thanks for this wonderfull toy. If you ll have time and energy i have few questions, if not, i ll figure it out eventualy

– What does the OHLC TF setting change?
– I set indie on “daily” TF and i m using 3 different TF (daily, 4h, 1h). Daily for daily direction. 4h for individual candle. 1h for timing. Would you agree with this aproach?
November 10, 2015 at 2:10 am #8923Hi Kiads….again thanks for this wonderfull toy. If you ll have time and energy i have few questions, if not, i ll figure it out eventualy
– What does the OHLC TF setting change? – I set indie on “daily” TF and i m using 3 different TF (daily, 4h, 1h). Daily for daily direction. 4h for individual candle. 1h for timing. Would you agree with this aproach?Hi Brother, for SSS Indicator OHLC TF setting is set to 15 minutes default, this only related to the ‘sensitivity’ of the ‘smiley’ signal line. Higher the TF setting , then the lines become fewer..
For 3 TF charting, yes Daily, H4, H1 is good, or alternatively H4, H1, M15 as your ‘daily’ watch because of their 4x step ratio, while Daily chart only for looking the big picture at the beginning of the day.
Also please understand the word ‘frame’ that meaning your chart is only ‘framing’ the movement at ‘that’ time visually, not the ‘whole’ market movement, while the market itself ‘move’ continuously like a ‘river’ in exactly same manner.
Hope it help and best regards
MTH
Intuition, Experiences and Common sense..
http://www.binaryoptionsedge.com/November 10, 2015 at 2:25 am #8924For our brother that ask me about ‘cyclical market behavior’ here we go the example

At the above example, you could see that this big ‘final down’ cycle sooner or later will be finalized. But, don’t be so sure that the ‘current’ price down movement will continue to reach that lowest ‘smiley’ line.. this week or next week.. lol.

MTH
Intuition, Experiences and Common sense..
http://www.binaryoptionsedge.com/November 10, 2015 at 3:50 am #8925Thank You All.. and good morning (my local time).. At the beginning of this week we see up signal on EU daily chart.. let see if this is what will happening today..at the end of the day… lol.
MTHSo, Yesterday result

You may wonder, why with up signal, most of the trade entries in short positions.. lol. This is because I ‘seeding’ this short positions previously and closed it one by one when market start to move up, and of course re-seeding my long positions on the way up.. until today when there’s down signal show up in EU daily chart. I’m not only trade EU, but all major pairs. Not simultaneously but waiting if there are ‘cycle curves’ that nearly ‘mature’..
MTH
Intuition, Experiences and Common sense..
http://www.binaryoptionsedge.com/November 10, 2015 at 8:09 am #8929Subscribed to this topic, hope can learn more from you
November 10, 2015 at 8:27 am #8930Hi Kiads.
Welcome back :) and thanks for your greats efforts for us.
One question, which tool is that you use to draw that arcs?
Thanks
November 10, 2015 at 8:38 am #8931One question, which tool is that you use to draw that arcs? Thanks
Hi Brother, I use MT4 default Fibonacci Arch Tool. If ‘she’ not show up in your Line Studies tool icons , just hover your cursor, right click, and select customize to show all the tools you want to use.
Best regards
MTH
Intuition, Experiences and Common sense..
http://www.binaryoptionsedge.com/November 10, 2015 at 9:10 am #8932Hello Kiads,
May i ask you how the “base” the smileys works?
Have a good day.
November 10, 2015 at 9:12 am #8933Hi Brother, for SSS Indicator OHLC TF setting is set to 15 minutes default, this only related to the ‘sensitivity’ of the ‘smiley’ signal line. Higher the TF setting , then the lines become fewer.. For 3 TF charting, yes Daily, H4, H1 is good, or alternatively H4, H1, M15 as your ‘daily’ watch because of their 4x step ratio, while Daily chart only for looking the big picture at the beginning of the day. Also please understand the word ‘frame’ that meaning your chart is only ‘framing’ the movement at ‘that’ time visually, not the ‘whole’ market movement, while the market itself ‘move’ continuously like a ‘river’ in exactly same manner. Hope it help and best regards MTH
Thanks you brother Kiads!
I did forgot to ask the first thing i wanted to know..lol.
What is the difference beetwen smiley, skull and star signals. Is it wise to use just one of those (smiley) or are they complementing each other?
One more thing, how do we interpret the smiley showing on both ends of the candle?
Sory for all the questions
 November 10, 2015 at 9:15 am #8934
Excellent results Brother.
I would love to see a few more examples and how you integrate 3 TFs into the analysis, making so many high probability trades possible in one day.P.S. To all Penguins, using a broker with GMT 0 is a very important thing in your technical analysis. When Kiads told me about this, at first i was a little hesitant. But once you load the exactly the same chart setup on GMT0 and your own broker, compare the two, you will see that it is very different, so you are trading out of sync – big disadvantage.
Best,
Edington M
November 10, 2015 at 10:12 am #8940Excellent results Brother.
I would love to see a few more examples and how you integrate 3 TFs into the analysis, making so many high probability trades possible in one day. P.S. To all Penguins, using a broker with GMT 0 is a very important thing in your technical analysis. When Kiads told me about this, at first i was a little hesitant. But once you load the exactly the same chart setup on GMT0 and your own broker, compare the two, you will see that it is very different, so you are trading out of sync – big disadvantage. Best, Edington MGreat tip Ed, thanks! It does make a difference…don t know why.
November 10, 2015 at 10:27 am #8941Thank You All.. and good morning (my local time).. At the beginning of this week we see up signal on EU daily chart.. let see if this is what will happening today..at the end of the day… lol.
MTHSo, Yesterday result
You may wonder, why with up signal, most of the trade entries in short positions.. lol. This is because I ‘seeding’ this short positions previously and closed it one by one when market start to move up, and of course re-seeding my long positions on the way up.. until today when there’s down signal show up in EU daily chart. I’m not only trade EU, but all major pairs. Not simultaneously but waiting if there are ‘cycle curves’ that nearly ‘mature’.. MTHEdannn ratusan juta per hari…mantep banget bang…jadi ngiler
 hehe
hehePlease explain more with pic. thanks.
November 10, 2015 at 10:29 am #8942It really make a different as my EU graph is really different from MTH’s. By the way how do we check our broker is starting from GMT 0?
November 10, 2015 at 10:42 am #8943You can just compare the broker time and GMT if you have Kiads market info indicator.(pic) Alternatively, right click on your mt4 market watch section, and check time option. Then compare that time to current London time. Exness is a good GMT 0 broker. You can open a demo, then use that for your analysis and charting, use your own account for trading.
Word of caution about Exness however – they offer high leverage accounts, but they reduce them significantly on friday to protect themselves from gap ups/downs. So if you have high leverage, be sure to take note, because when they switch your account from 500:1 example to 100:1 on friday, it might lead to a margin call, depending on your balances.
Best,
Edington M
Attachments:
You must be logged in to view attached files.November 10, 2015 at 10:54 am #8945Thanks Edin, i will try it when i am on my pc. :)
November 10, 2015 at 1:17 pm #8946may this help to find server time
Attachments:
You must be logged in to view attached files.November 10, 2015 at 2:36 pm #8951Thanks alot Fast!! :)
November 10, 2015 at 3:20 pm #8952If anyone has an explanation of the meaning of the smiley, skull and stars I would like that information as well. Thanks in advance.
Thanks you brother Kiads! I did forgot to ask the first thing i wanted to know..lol. What is the difference beetwen smiley, skull and star signals. Is it wise to use just one of those (smiley) or are they complementing each other? One more thing, how do we interpret the smiley showing on both ends of the candle? Sory for all the questions
November 10, 2015 at 4:29 pm #8956Hi Kiads
,Long time no see,,how are you? I hope you and your family is well..
Can I take a seat in your thread? I will learn it fom beginning because long time no trade :D
Thanks for your learn and your indicator
November 10, 2015 at 10:10 pm #8963If anyone has an explanation of the meaning of the smiley, skull and stars I would like that information as well. Thanks in advance.
The star shows the direction for the next bar. The skull shows the direction for the current bar. When they are on top means that it should go down, and visa versa.
I’m not using the smiley, but I think it shows a higher high and a lower low. Possibly those points may be returned to at some point in the future (maybe years away).
November 11, 2015 at 2:28 am #8973If anyone has an explanation of the meaning of the smiley, skull and stars I would like that information as well. Thanks in advance.
The star shows the direction for the next bar. The skull shows the direction for the current bar. When they are on top means that it should go down, and visa versa. I’m not using the smiley, but I think it shows a higher high and a lower low. Possibly those points may be returned to at some point in the future (maybe years away).
Thank You Brother BlackStack for the explanation..
And for all, as you know that I’m one of ‘repaint’ indicators lover so this SSS indicator also one of this ‘repaint’ indicator ..lol.
I already explain in post 1, that you can’t only rely on TA tools only to reach your success in trading, especially MT4 Indicators whatever they are..
About Smiley Icon and lines.. , this is similar to supply demand marker, they ‘mark’ where the supply/demand area previously happened, and in general meaning that someday in the future price will visit there again.. and again, since actually all this market activities only back and forth movements in certain range.. that very predictable in long term point of view.
for example EUR/USD can’t go to zero .. or it will be very hard to go to 0.5000 etc.. because with zero value, meaning there’s no European Union and USA. Or if EUR/USD goes to 2.0000 this also became hard to EU to entry USA market, so it will also difficult for EUR/USD to reach value 2.0000 meaning we have ‘range’ between 0.5000 to 2.0000 to play and this is our ‘playing field’ in long term point of view.
You could create your own ‘range’ according to your trading style, let say for 1 year ‘range’ analysis, or 1 month ‘range’ analysis, 1 week, etc so, you could calculate your MM strength to avoid you from margin call. Just remember, shorter the range period, higher the risk that your ‘range’ will be break.
Back to ‘Smiley’, in short this ‘smiley’ lines visually show you in general where the ‘current range’ is..
BTW, if you read since the beginning of this thread that I tell you the ‘daily signs’ from day before yesterday that signaling up, and yesterday that signaling down, and today seem signaling up again.., basically you will know where the price will go since the beginning of the trading day. This only ‘probability’ but when you already calculate your MM strength and could handle your risk then you could take the advantage of this ‘probabilities’ and convert it to you profit.. lol.
Happy Trading Guys..
MTH
Intuition, Experiences and Common sense..
http://www.binaryoptionsedge.com/November 11, 2015 at 5:39 am #8976Hi All….. As promise this is the ‘lite’ version of my Star Skull and Smiley Indicator, and because this is sub sequencer indicator you should understand that the main purpose of this indicator is to understand your ‘playing field’, not only individual signal to entry or exit. Learn basic knowledge on how market work is a must.. and honestly your success in financial world base on this knowledge, not from your TA tools. When I enjoy my hospital trip, even my son (16 years old) could continue my trading account with very nice result, not because of many sophisticated TA tools, but because he ‘already’ understand how market work… that’s it. So, in this SSS indicator you will see so many setting that mostly for ‘appearance’ setting, let’s just try the default first, and this indicator work better in higher TF as reference and combined with lower TF for execution. If you familiar with 3 TF charting concept you will see ‘more’ from this indicator. Later, I will explain one by one the indicator setting, and maybe ‘review’ on how to use her.. lol. And… if you asking about the ‘result’ ? lol, again and again result will be vary depend on your previous knowledge on understanding the market, for me (or my son for the last 5 weeks..) with market cyclical knowledge the result could be zero draw down.. and more than 500 consecutive win trade, but just remember that with very exactly same ‘knife’ you could kill your self in second.. lol.
 To Install, just copy indicator to your Data Folder / MQL4/Indicator fodler and her speak library to MQL4/Library folder the default for voice alert is false, and also the ‘voice’ setting is still blank. Note1 = “Speech Setting”; AlertText = ” “; you could fill above setting with anything you want as your first attention like your name or ‘boss’, sir etc or keep it blank.. BrokerNameText = ” “; If you open more than 1 MT4 instance from different brokers, the above setting could help you by typing your broker name of their short name as you like, or keep it blank if you only use 1 MT4 with this indicator. Currency1Text = ” “; for example if you put this indicator at your EURUSD chart, you could put ‘Euro’ text here, or for USD JPY you could put ‘US Dollar’ here Currency2Text = ” “; and related to the above for EURUSD chart you could put ‘US Dollar’ text here, or for USDJPY you could put ‘Japanese Yen’ here.. ChartStyleText = ” “; for default candlestick chart you could leave it blank, or if you put this indicator to renko chart etc, you could put the type name of the chart here… Ok guys, for this moment.. Enjoy playing this new toys.. and remember don’t play with your real hard earned money, play with your brain and make profit with your money.. Have a nice week end and Best Regards MTH
Nice to see you again bro … and thanks a lot for your generosity, as always …
November 11, 2015 at 5:47 am #8977If anyone has an explanation of the meaning of the smiley, skull and stars I would like that information as well. Thanks in advance.
The star shows the direction for the next bar. The skull shows the direction for the current bar. When they are on top means that it should go down, and visa versa. I’m not using the smiley, but I think it shows a higher high and a lower low. Possibly those points may be returned to at some point in the future (maybe years away).
Thank You Brother BlackStack for the explanation.. And for all, as you know that I’m one of ‘repaint’ indicators lover so this SSS indicator also one of this ‘repaint’ indicator ..lol. I already explain in post 1, that you can’t only rely on TA tools only to reach your success in trading, especially MT4 Indicators whatever they are.. About Smiley Icon and lines.. , this is similar to supply demand marker, they ‘mark’ where the supply/demand area previously happened, and in general meaning that someday in the future price will visit there again.. and again, since actually all this market activities only back and forth movements in certain range.. that very predictable in long term point of view. for example EUR/USD can’t go to zero .. or it will be very hard to go to 0.5000 etc.. because with zero value, meaning there’s no European Union and USA. Or if EUR/USD goes to 2.0000 this also became hard to EU to entry USA market, so it will also difficult for EUR/USD to reach value 2.0000 meaning we have ‘range’ between 0.5000 to 2.0000 to play and this is our ‘playing field’ in long term point of view. You could create your own ‘range’ according to your trading style, let say for 1 year ‘range’ analysis, or 1 month ‘range’ analysis, 1 week, etc so, you could calculate your MM strength to avoid you from margin call. Just remember, shorter the range period, higher the risk that your ‘range’ will be break. Back to ‘Smiley’, in short this ‘smiley’ lines visually show you in general where the ‘current range’ is.. BTW, if you read since the beginning of this thread that I tell you the ‘daily signs’ from day before yesterday that signaling up, and yesterday that signaling down, and today seem signaling up again.., basically you will know where the price will go since the beginning of the trading day. This only ‘probability’ but when you already calculate your MM strength and could handle your risk then you could take the advantage of this ‘probabilities’ and convert it to you profit.. lol. Happy Trading Guys.. MTH
today i start to test her in EXNESS cent account. let’s see if i can manage the low drawdown profitable trading result.
how can you achieve more than thousand trades with just 4 losses & almost no drawdown. you use stoploss bro?
- AuthorPosts


 To Install, just copy indicator to your Data Folder / MQL4/Indicator fodler and her speak library to MQL4/Library folder the default for voice alert is false, and also the ‘voice’ setting is still blank. Note1 = “Speech Setting”; AlertText = ” “; you could fill above setting with anything you want as your first attention like your name or ‘boss’, sir etc or keep it blank.. BrokerNameText = ” “; If you open more than 1 MT4 instance from different brokers, the above setting could help you by typing your broker name of their short name as you like, or keep it blank if you only use 1 MT4 with this indicator. Currency1Text = ” “; for example if you put this indicator at your EURUSD chart, you could put ‘Euro’ text here, or for USD JPY you could put ‘US Dollar’ here Currency2Text = ” “; and related to the above for EURUSD chart you could put ‘US Dollar’ text here, or for USDJPY you could put ‘Japanese Yen’ here.. ChartStyleText = ” “; for default candlestick chart you could leave it blank, or if you put this indicator to renko chart etc, you could put the type name of the chart here… Ok guys, for this moment.. Enjoy playing this new toys.. and remember don’t play with your real hard earned money, play with your brain and make profit with your money.. Have a nice week end and Best Regards MTH
- You must be logged in to reply to this topic.