› Forums › Development › Trading Systems – Development › MTH – TZ and her friends for manual trading all TF
Tagged: MTH, TZ Indicator
- This topic has 381 replies, 84 voices, and was last updated 8 years, 8 months ago by
 rainbow101.
- AuthorPosts
- December 12, 2014 at 9:01 am #1191
Attached…Same Indie, with buffer 0 only, with direction lines, peak & Trough marking, and divergence (Red=Normal, Yellow=Hidden)
It requires the original one in “Indicators” folder.
G.
Thank Youuu.. so much my Brother GG53, she look so fantastic.. when combine with TZ..and on array Bollinger Band.
Definitely I will study her further..
Best Regards
MTHIntuition, Experiences and Common sense..
http://www.binaryoptionsedge.com/December 12, 2014 at 9:20 am #1192Thanks GG and Kiads.
@Kiads, your new toy FxGT on array BB is nice. Just using that indicator, i am sure it is profitable. Just Sell on Red dot, IF the dot appear above red horizontal line. And just Buy at green dot, if it is appear below green horizontal line.
If we combine it with TZ, wow wow wow …, a powerful tool
And Saver0’s idea on Bull/Bear difference will be also interesting …
 December 12, 2014 at 10:24 am #1193
In my previous post about GG53 ForexGT TVDiv, I’m not talking about ‘current event’..
Is ‘right there’ my Brothers and Sisters.. ‘what next’ probability potential of this beautiful indicator.
Imagine if we apply ‘her’ to higher TF like Daily, Weekly, or even Monthly chart.
Yes of course is not 100% right, but look at the accuracy ratio..
the vertical line mark the peak and through dot appearances and the vertical line style, show you if the peak/through dot color is in confluence with current candle direction or not. and you may look at the ‘next day’ candles because this is more important when we want to ‘classified’ indicator as ‘useful or useless’ and what the accuracy of indicator to projecting “probability of future candles”.

MTHIntuition, Experiences and Common sense..
http://www.binaryoptionsedge.com/December 12, 2014 at 11:00 am #1194First thanks for sharing those indicators gg53.
Is it normal that both FX tick volume and Divergence are not updating? Maybe its just me"A dream you dream alone is only a dream. A dream you dream together is a reality." (John Lennon)
December 12, 2014 at 11:09 am #1195First thanks for sharing those indicators gg53.
Is it normal that both FX tick volume and Divergence are not updating? Maybe its just meYes My Brother, is not automatically updating, you can switch TF back and forth to update, so I suggest you use ‘them’ for higher TF.
Best Regards
MTHIntuition, Experiences and Common sense..
http://www.binaryoptionsedge.com/December 12, 2014 at 11:15 am #1196Hi GG and MTH
I have downloaded the tick generator indi’s but my display is very different from yours? Do I need some other indi?
maahome
Attachments:
You must be logged in to view attached files.December 12, 2014 at 11:23 am #1198Hi GG and MTH
I have downloaded the tick generator indi’s but my display is very different from yours? Do I need some other indi?
maahome
No My Brother, there’s nothing wrong with your ForexGT TVDiv, I attach (click and drag) Bollinger Band to ‘her’ with Period 4, Shift 1, Deviations 1, Apply to : First Indicator Data (to read buffer 0 of ForexGT TVDiv).
Maybe that the different..
Hope it help and best regards
MTHIntuition, Experiences and Common sense..
http://www.binaryoptionsedge.com/December 12, 2014 at 12:22 pm #1201Thanks for sharing gg53
Thanks for the ideas Kiads
Pips be with you!
Regards
December 12, 2014 at 1:15 pm #1208Hi,
Thanks GG, Kiads and other contributors.
I try to install FxGT_Div , but i get this at the right side of chart. How to solve this ?
But, if i scroll to the left, then i can see the right image. It is great. I add BB on it, and of course TZ, SS, CI, ZZ.
I think it is powerful … will test it next week …
@Kiads,
How to call image from photobucket ? I tried using :<img src="xxxx.jpg" />or
So, i just put a link for temporary :http://xxxxxx.jpg.html
ThanksEDIT :
*) Sorry, you have written good stuffs while i posted Kiads. Understood, thanks a lot.
*) Thanks Kiads, i can put image from photobucket here now ….-
This reply was modified 11 years, 6 months ago by smallcat.
-
This reply was modified 11 years, 6 months ago by smallcat.
-
This reply was modified 11 years, 6 months ago by smallcat.
-
This reply was modified 11 years, 6 months ago by smallcat.
-
This reply was modified 11 years, 6 months ago by smallcat.
-
This reply was modified 11 years, 6 months ago by smallcat.
-
This reply was modified 11 years, 6 months ago by smallcat.
-
This reply was modified 11 years, 6 months ago by smallcat.
-
This reply was modified 11 years, 6 months ago by smallcat.
-
This reply was modified 11 years, 6 months ago by smallcat.
December 12, 2014 at 3:11 pm #1220Hi My Brother,
Bull Bear was my oldest main tool.. lol, even before I use renko chart, or learning about BB, 3d Geometrical, TZ, Sub Sequence, etc. And I can make sure that we can make a consistent profit with this twin, as long as we know what we should looking for..
….
phewwwww….just off from a very busy workday and saw this post…..
wat aaa……man u superb!
TQTQTQ …hehe…all the best for you bro!
-
This reply was modified 11 years, 6 months ago by paladim.
~~~* life got hope: by the generosity of friends & you *~~~
December 12, 2014 at 3:12 pm #1221Hi guys, i just noticed the red/yellow dots on the volume divergence indi are painted on last two bars and not on current or previous bar, so dont trade off the dots alone, rather use them for bias confirmation.
Pips be with us
Regards-
This reply was modified 11 years, 6 months ago by Femo.
December 12, 2014 at 3:35 pm #1224Bro MTH,
The BullBear Shapes when “gradually weaken” on tat picture, meant the bear is gradually loss its down trend power, and going to bull move soon?

Thanks.
~~~* life got hope: by the generosity of friends & you *~~~
December 12, 2014 at 4:16 pm #1225My Brother @paladim
Yes that what Bull/Bear tell us, and it happened for the last 2 or 3 H4 right..
Best Regards
MTHIntuition, Experiences and Common sense..
http://www.binaryoptionsedge.com/December 12, 2014 at 4:19 pm #1227Hi,
Thanks GG, Kiads and other contributors.
I try to install FxGT_Div , but i get this at the right side of chart. How to solve this ?
http://s1378.photobucket.com/user/smallcat8/media/ForexGT-div-problem_zpscc12813c.jpg.html
But, if i scroll to the left, then i can see the right image. It is great. I add BB on it, and of course TZ, SS, CI, ZZ.
I think it is powerful … will test it next week …
http://s1378.photobucket.com/user/smallcat8/media/TZ-SS-ZZ-CI-GT-LOBB_zpsca6c3593.jpg.html
@Kiads,
How to call image from photobucket ? I tried using :
So, i just put a link for temporary :http://xxxxxx.jpg.html
ThanksMy Brother, from photobucket picture you want to linked here, select share and click direct link, then here click img and paste your picture link, and that’s it..
Hope it help and best regards.Intuition, Experiences and Common sense..
http://www.binaryoptionsedge.com/December 12, 2014 at 4:48 pm #1231My Brother, from photobucket picture you want to linked here, select share and click direct link, then here click img and paste your picture link, and that’s it..
Hope it help and best regards.Got it, thanks mate.
December 12, 2014 at 7:20 pm #1235Hi G,
No, this is still using Close[0] of the 5 min.
Unfortunately, I have encountered a programming issue changing this from a static to dynamic – so the picture your seeing is only verifying 10 bars.
It is interesting to note that when you start seeing a confluence of these TZ’s , that a [possible significant] move becomes imminent. Unfortunately I have yet to figure out how to determine the next jump, even with this information.
I’ll get around to posting more charts later tonight…unfortunately I am still a slave at my job…..
December 13, 2014 at 3:44 am #1250Hi guys, i just noticed the red/yellow dots on the volume divergence indi are painted on last two bars and not on current or previous bar, so dont trade off the dots alone, rather use them for bias confirmation.
Pips be with us
RegardsForexGT_TickVolume_Divergence:
Dots are marked (no repaint) AFTER next bar close.
Same with normal (red) or hidden (yellow) divergence line.G.
December 13, 2014 at 3:56 am #1253I can only repeat my previous suggestion/request:
Create an indie that counts the ticks per bar.
Mark the bar that has more than 130%-150% (better to use external param for it) ticks than average in it –
You will get a marker for your TZ.G.
-
This reply was modified 11 years, 6 months ago by gg53.
December 13, 2014 at 7:04 am #1257Hi G,
No, this is still using Close[0] of the 5 min.
Unfortunately, I have encountered a programming issue changing this from a static to dynamic – so the picture your seeing is only verifying 10 bars.
It is interesting to note that when you start seeing a confluence of these TZ’s , that a [possible significant] move becomes imminent. Unfortunately I have yet to figure out how to determine the next jump, even with this information.
I’ll get around to posting more charts later tonight…unfortunately I am still a slave at my job…..
I don’t know what u r reffering to…
G.
December 13, 2014 at 9:35 am #1261Hi Kiads!
i am following the similarity -TZ subject about last month! and i was very interested in your sight in the trading and your logical and science looking to any object in fx . as i missed you in ff caused me to be concerned how you can find you again !fortunately i find you again ! bless to you ! and sorry for my weak English! subscribed !December 13, 2014 at 9:50 am #1262
Hello, Friends! I continue to watch the Bull & Bears indicator. Found a similar which displays the data in a single window. Also funny indicator that shows the trend lines are especially good at Renko chart.

Hi Everybody,
Pls take note is the Bear_Bulls_Power.mq4 indicator actually a Fisher Indicator, and the Fisher Indicator repaints so I’m not sure if its good for live trading, Pls advise. I think the code is Fisher and there are a lot of variants (SEFC Bulls-Bears.mq4, Solar Winds joy – histo.mq4 & Symphonie_Sentiment_Indikator_v3.0.mq4) running on the web, you can check out forex tsd forum where they open a thread on repainting fisher indicator. Pls correct me if I’m wrong, thx. Just don’t want ppl to lose $ trading repainting indicators. FYI, There’s a non-repainting fisher & inverse fisher indicator by igorad on his own website (newdigital-world.com) but it doesn’t look as impressive as repainting fisher on history charts though. Sorry I actually didn’t want to promote other websites but info can be found there, Just my 2 cents. Pls don’t hesitate to correct me if I’m wrong, always willing to learn, thx for all advices.
Best Regards,
LearnAlways-
This reply was modified 11 years, 6 months ago by LearnAlways.
-
This reply was modified 11 years, 6 months ago by LearnAlways.
I only know I know nothing
Skype: learnalways@outlook.comDecember 13, 2014 at 11:17 am #1268Hi Everybody,
Pls take note is the Bear_Bulls_Power.mq4 indicator actually a Fisher Indicator, and the Fisher Indicator repaints so I’m not sure if its good for live trading, Pls advise. I think the code is Fisher and there are a lot of variants (SEFC Bulls-Bears.mq4, Solar Winds joy – histo.mq4 & Symphonie_Sentiment_Indikator_v3.0.mq4) running on the web, you can check out forex tsd forum where they open a thread on repainting fisher indicator. Pls correct me if I’m wrong, thx. Just don’t want ppl to lose $ trading repainting indicators. FYI, There’s a non-repainting fisher & inverse fisher indicator by igorad on his own website (newdigital-world.com) but it doesn’t look as impressive as repainting fisher on history charts though. Sorry I actually didn’t want to promote other websites but info can be found there, Just my 2 cents. Pls don’t hesitate to correct me if I’m wrong, always willing to learn, thx for all advices.
Best Regards,
LearnAlwaysHi My Brother, that’s why i still use classic standard Bull/Bear Indicators.. and when we use Indicators, I believe that we should look at the whole, not only current candle signal etc. As long as you know how to dealing with ‘repaint’ indicators and also you know how market work, then there’s no problem at all. My SSA CycDiv Indicator also ‘repaint’ if you think that ‘normalizing’ process is ‘kind of repaint’. but a lot of our friends who could use ‘her’ wisely take the advantage of ‘her’.
Best Regards
MTHIntuition, Experiences and Common sense..
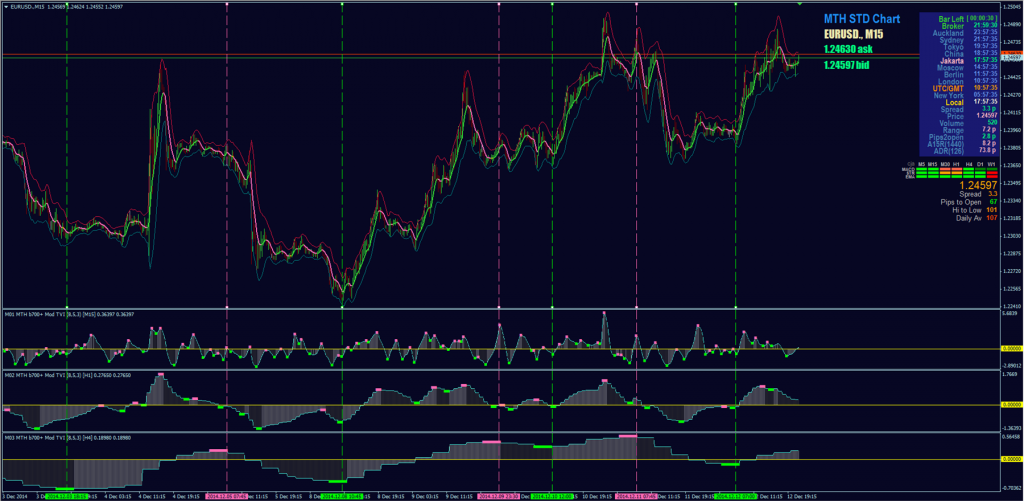
http://www.binaryoptionsedge.com/December 13, 2014 at 11:24 am #1270Hi All, because ForexGT Tick Volume Indi, sometime not automatically refresh.
I decided to create my own Tick Volume Indi and add several functions including Indicator ID, MTF, auto histogram resize, alert, Histo/Line selectable, e-mail, buffer 0 on array ready. etc.
You can load more than one instance into your chart for different TF, but don’t forget to give ‘her’ different Indicator ID string.
The example above EURUSD M15, with TVI M15, H1, and H4.
Hope it help and best regards
Have a nice Weekend.. all
MTHAttachments:
You must be logged in to view attached files.Intuition, Experiences and Common sense..
http://www.binaryoptionsedge.com/December 13, 2014 at 11:46 am #1273Hi MTH2014(Kiads),
I got nothing against repainting indicators, actually I myself use it also, TMA slope to define range market from trend market because until now I still haven’t found a better indicator to differentiate between range and trend. But I just post to warn others who might not know what they are actually using because they might not be coders. I only found out the hard way just don’t want others to suffer like me. haha.
Best Regards,
LearnAlways-
This reply was modified 11 years, 6 months ago by LearnAlways.
I only know I know nothing
Skype: learnalways@outlook.comDecember 13, 2014 at 12:29 pm #1278 -
This reply was modified 11 years, 6 months ago by
- AuthorPosts


- You must be logged in to reply to this topic.