› Forums › General Discussions › Renko + Double dose of Heiken Ashi
- This topic has 11 replies, 5 voices, and was last updated 11 years, 4 months ago by
 gg53.
gg53.

- AuthorPosts
- April 18, 2015 at 2:31 pm #6357
Dear Fellow Traders,
I have been exploring the combination of Renko charts and various Heiken Ashi methods. I have always been drawn to Renko, I in particular admire all the work our brother KIADS has put towards Renko. It is Saturday and I have nothing better to do, so why not start a small discussion here. After all, this is a forum to discuss concepts, share ideas and hopefully we can all learn from each other.
For those of you familiar with Renko understand the advantages of using it in contrast to regular charts. However, there are some problems that hinder the method. I have seen many methods of trade entry and trade exit, using countless indicators etc. Now, regardless the method, Renko tends to do very well during strong movements, but tends to encounter problems during sideways market/ranging periods. After running many simulations, I have concluded that entry/exit on renko bar alone ultimately is not efficient – at best you break even as you have to give back all the pips you made during the trend back to the range period. My idea is to minimize indicators, go KIS(keep it simple) with it and to achieve positive results in the long run. The idea is to use only heiken ashi for trade decisions. Importantly, I do not claim that this idea is original. It is still very raw. I know several threads on ff that have discussed this, but most of them reach exhaustion when it comes to how to solve the ranging market problem. At this point, they add on many indicators etc, some of them work some of the time etc, no real solution.I have no illusions that the problem can be solved completely. However, i do believe that if you make e.g. 1000 pips in a trend, you could pass the range period and still hold 500.

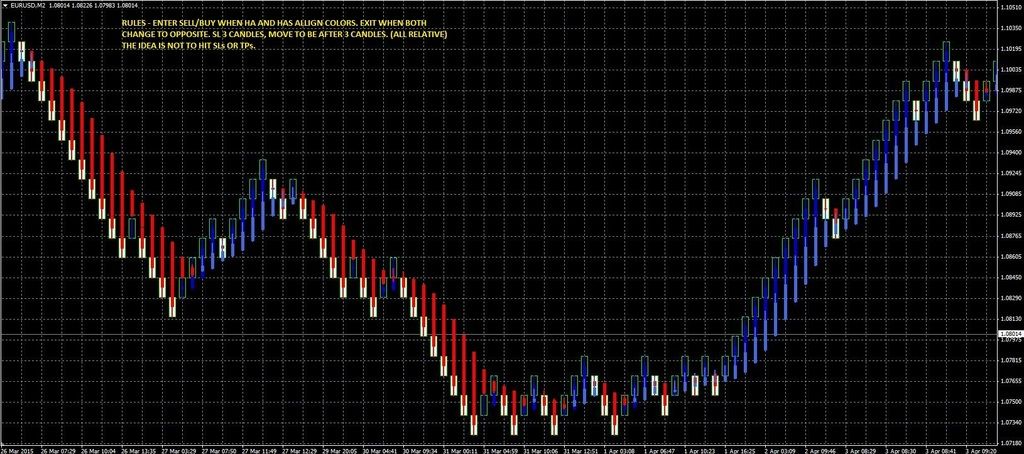
First I would like share my chart setup. Now,the only indicators used are Heiken-Ashi, and Heiken Ashi Smoothed. You can get them from many places, Google is your friend. i will share the template. Now, as you can observe from the attached chart, the strategy works…until you hit the range. My idea is this. Once a trade produces a loss, lets say a sell trade, you should not enter another sell trade within a defined zone even if the HA and HAs align again. The defined zone would be recent low to recent high. Now within the zone, if a buy condition occurs and results in a loss, no buy trade should be taken within a zone of recent low to recent high. Now once the Price Action leaves the zone, and conditions to enter a trade are aligned, you should enter the trade. The idea is to minimize loses during range. Now the only way to create this “zone” would be manual, as i have very limited coding experience and can not make it into an indi.

So, traders, what do you think about such an approach? My hope is to hear some discussion, criticism and some new perspectives.
Have a good weekend everyone.
Best, Michael
-
This topic was modified 11 years, 5 months ago by Edington. Reason: grammar
Attachments:
You must be logged in to view attached files.April 19, 2015 at 2:43 pm #6374Hi Brother, Congratulation for your thread.. definitely I subscribed..

This is only my noob personal opinion, please correct me if I’m wrong..
Since this is about renko chart, in my limited understanding, renko chart is the attempt to ‘visually smoothing’ the price continuing movement with ‘slashing’ that using ‘predetermined price range’ in contrast with candlestick chart that ‘slashing’ price movement with ‘predetermined time range’.
So, basically candlestick chart or renko chart or other chart types are tools to visually ‘smoothing’ price movement to make it more understandable for further analysis..
Especially about renko, as I already mention several times before, this is a ‘visual’ high low tool so just exactly same with ZigZag so, we could call her, Zig Zag with fancier shape…lol.
In the other hand, actually ‘Heiken Ashi’ (and all her ‘smoothed’ versions), that the ‘idea’ also came from Japan like ‘Renko’, basically also another ‘way’ of ‘smoothing’ using Moving Average.
So, ‘Heiken Ashi’ is Moving Average in the ‘visually’ shape of candlestick.. and ‘her’ creation is to replace standard candlestick chart.. (you may read the explanation in about tab of this indicator).
In Conclusion, applying ‘Heiken Ashi’ on top of renko chart is like ‘smoothing’ the price movement several times, and the logical result of course you will get ‘lagging’ phenomenon..
and.., in ranging market conditions any ‘lagging’ visual information will make you in trouble.. for sure..
Again, in my personal limited knowledge about visual technical analysis, you only need ‘averaging’ tools in trending market to ’emphasized’ the trend bias, while in ranging market you need ‘channeling’ tools (including any oscillators), to mark the current ‘range’.
Hopefully you understand and once again please forgive me if I’m wrong.
Happy Trading and wish you all the best
MTH
Intuition, Experiences and Common sense..
http://www.binaryoptionsedge.com/April 19, 2015 at 4:31 pm #6377Dear Brother,
Thank you for your valued input. I absolutely agree that Heiken Ashi is a visual smoothing, and basically when applied to a Renko chart, you are smoothing out something that is already smoothed. Applying the Heiken Ashi Smoothed, is going one step further and smoothing that. lol Now, the HA candle is based on price action data(open,high,low,close) of the current and previous candle.(bar) I understand that renko has a pre-defined bar size. The main advantage is that once a HA candle is formed, either on regular or renko chart, it does not repaint further down the road after the current bar closes. As to my limited understanding, zig-zag does as new low/high is formed in the next candles. Please correct me if i am wrong.
What led me to open this discussion is a thread from ff – http://www.forexfactory.com/showthread.php?t=513860 . ( I hope that posting a link will not upset the admin. It will be removed upon request) The gentleman uses this approach rather successfully using only Renko and HA. Again, as I have clearly indicated in my opening post, “ I do not claim that this idea is original” .
My hope here is to examine the feasibility of improving upon such an approach without further addition of oscillators and other indicators. Keeping it as simple as possible…If it can be done.
I could be totally wrong about this approach, and the worst thing is that i could do is waste is little time exploring it. But I don’t think it is wasted if you learn along the way

Brother, calling your your knowledge of Renko or Technical Analysis – noob or as you say limited, actually makes me feel very bad…because if that was true, i don’t know how to even describe my own knowledge in contrast…a 1 year old baby lol. Its reminds me of Socrates statement of “I know I know nothing.”
Best,
Michael
April 22, 2015 at 1:52 pm #6388Hi Michael,
I see this issue time and again regarding repainting as some say certain indicators repaint when its not actually what happens. In the case of zigzag its a predictive indicator so it definately will paint differently. i.e if you load it on a chart it looks all fine and dandy, take some screen shots, then wait some time and then take another screen shot of the same bars and it will look differently. This is what is referred to as repainting.
In the case of HA it is not predictive so a side from the current bar changing which it does as the current HA bar is forming the previous bars will always look the same. i.e. it doesn’t repaint.
I have seen comments in the TZ threads about zones repainting, well this isn’t actually right, TZ is not predictive and that was just the way the indicator was written. The issue there is that when the data is loaded it doesn’t redraw all the previous TZ failures only the actual zones, and then starts painting the PTZ so over time if you leave the chart open you see lots of failed zones, close and reopen and they are gone. As I said this sort of indicator doesn’t repaint it just doesn’t choose to paint the old zones.
Hope that helps so in short only predictive indicators should repaint, if it isn’t predictive its usually by design or a bug.
April 22, 2015 at 5:47 pm #6390Hey Pfx,
Yes, you are absolutely correct. Thank you for your input. I was not trying to imply that zig zag as a predictive indicator was not useful. As you have suggested, there is clearly a difference between a predictive indicator, such as zig zag – that changes due to a new high/low and indicators that was coded to repaint(dime a dozen), promoted by various fx companies to look better so they could sell them.
Unfortunately, many people run away when they hear repaint because they put everything in the same basket.
Best,
Michael
April 23, 2015 at 7:59 am #6391Hi Edington
if you can upload the all indy,I just see the tpl
thx a lot.
April 23, 2015 at 9:01 am #6392Blueface,
The only indicators used are HA and HAS. I will send them to you via PM. GL. If anyone else needs them, they are widespread and can be easily downloaded if you google them.
Please note that, this is only a crude approach that needs refinement, in particular to eliminate ranging periods, perhaps by the approach i suggested in my post.
Best, Michael
-
This reply was modified 11 years, 5 months ago by Edington.
April 25, 2015 at 7:33 am #6408Hi Brother,
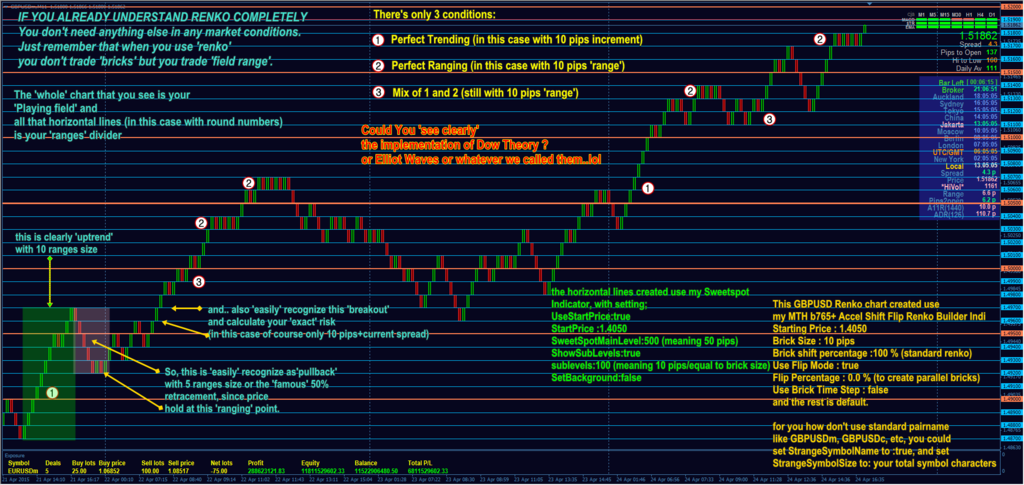
this is example of my renko ‘point of view’

You ‘may’ also notice, when in ‘perfect ranging’ condition, the bricks ‘divided’ evenly between ‘bullish’ and ‘bearish’ bricks, and the ‘last’ brick ‘always’ pointing the ‘next’ direction..

Have a nice week end all…
Best Regards
MTH
Intuition, Experiences and Common sense..
http://www.binaryoptionsedge.com/April 26, 2015 at 8:20 am #6409Dear Brother,
I really enjoy the way you look at the chart. You make it looks so simple. For some reason it reminds me of this quote > “Do not try and bend the spoon. That’s impossible. Instead… only try to realize the truth. There is no spoon. Then you’ll see, that it is not the spoon that bends, it is only yourself.” Thank you. Have a great Sunday
Best,
Michael
May 6, 2015 at 10:06 pm #6531There is only one problem with the above charts.
Many times the price goes above/below the current “box”, doesn’t complete the xx box pips, and goes into the opposite direction.
Those movements are not shown on Renko chart in retrospect – but causes a false trade entry in real-time.
G.
May 6, 2015 at 10:57 pm #6532Hey gg53,
This is true and the only way to counter it is to trade only when the bar completes, assuming that your trade conditions are met. The same principle would apply to the “zone”, price can penetrate the upper/lower barrier, but no trade would be taken until a bar closes above/below it.
P.S. I admire your work on the Killing zone and Gadi. I discovered it recently.
Best,
Michael
May 7, 2015 at 2:22 am #6535Hey gg53, This is true and the only way to counter it is to trade only when the bar completes, assuming that your trade conditions are met. The same principle would apply to the “zone”, price can penetrate the upper/lower barrier, but no trade would be taken until a bar closes above/below it. P.S. I admire your work on the Killing zone and Gadi. I discovered it recently.
Best, MichaelI think you misunderstood my meaning.
Assume 10 pips Renko bar.
Price goes up 8 pips after a closed up box, you go long on the close, and than price goes down 18 pips, closing a new down box. Lost trade.
on the previous example – you waited for the down close box, and entered a short trade. Price goes down 8 pips, then up 18 pips. another lost trade.
G.
-
This topic was modified 11 years, 5 months ago by
- AuthorPosts







 Best, Michael
- You must be logged in to reply to this topic.