› Forums › Development › Trading Systems – Development › MTH – TZ and her friends for manual trading all TF
Tagged: MTH, TZ Indicator
- This topic has 381 replies, 84 voices, and was last updated 8 years, 9 months ago by
 rainbow101.
- AuthorPosts
- January 1, 2015 at 5:33 am #2881
Dear Simplex !
thankyou so much to your briefing!
but anyway as we want to could take some position based on these TZ indi then we have to decrease fake TZ as much as possible! then i think up to that while which a powerful indi can calculate the PTZ based on real time (no based on the candles chart) we must filter some fake PTZ by multi time frames monitoring!
my suggestion is filtering the faked PTZ on the timeframes in compare with M1 ptz in that point! i mean M1 as the smallest unit in candle stick charts could be act as a reference to show us if a point(smallest unit in price) has been recurrence or transient!January 1, 2015 at 12:48 pm #2889we have to decrease fake TZ as much as possible
I’m not sure I understand what you mean by fake TZ. Maybe PTZ that will not be confirmed?
we must filter some fake PTZ by multi time frames monitoring
I also thought about an MTF approach. Anyway I’m sure (without having a mathematical proof, though) that we may not assume that TZ events analyzed at one point in time (realtime) in different timeframes are statistically independent of each other. Thus we must not multiply single probabilities to find some compound probability. We only can determine that compound probability experimentally. This requires sophisticated coding.
A good trader is a realist who wants to grab a chunk from the body of a trend, leaving top- and bottom-fishing to people on an ego trip. (Dr. Alexander Elder)
January 1, 2015 at 4:33 pm #2894============================================================== About what TwoBlink say, the principle is like how ‘radar’ or ‘sonar’ or ‘GPS’ work. measuring current position from 2 different ‘watch point’ ,triangulate it then re-calculation with constant time frequency, you will get ‘movement speed (momentum)’ and ‘direction change (angles)’. that’s why ‘he/she’ mention about looking chart from right to left. If you get ‘movement speed’ and ‘direction’ you could projected the ETA (Estimated Time Arrival) exactly just like an airplane or ship or car, or guided missiles.. lol. We could do this with geometrical stuff / chart objects like ‘arch’ and ‘triangles’ or some specific calculation with indicator (this where ‘Pi’ involved ..lol).. Best Regards MTHHi Kiads,You are definitely smart. Looking forward to your geometry stuff (is there by any sense, sacred geometry involved, haha). Pls count me in.Do u mind explaining the mini-saddle thing in layman terms(easy to understand) as what u said above. Thanks. Pls see attached pic for twoblink understanding of forex.
Hope it help and best regards
MTH
Intuition, Experiences and Common sense..
http://www.binaryoptionsedge.com/January 2, 2015 at 6:55 am #2904is it somethings like Gann theorem( grid Gann 45degree- 135degree)?
January 2, 2015 at 6:58 am #2905dear Simplex
I meant “fake TZ” was a clear price point which we have a TZ in all of time frame except one time frame or reverse: we have a TZ in one time frame but dont have in that price on other time frames.(because if price has been recurrence then it must be recurrence on all the time frames)
thankyou for your explanation about multi timeframe. i am trying to digest it.January 2, 2015 at 8:47 am #2908thank you kiads now it is working fine
January 2, 2015 at 11:57 am #2921because if price has been recurrence then it must be recurrence on all the time frames
In this general wording, I believe that your statement is wrong. I would prefer to state a little more carefully:
For two given timeframes TF0 and TF1, where TF1 = N * TF0 and N > 1, price is h0-recurrent in TF0 if price is h1-recurrent in TF1 and h0 = N * h1.
Hmm – correct?
 Still thinking …
For h1-intervals other than h1 = N * h0, … hmm – some more thinking should be applied.
 Those thoughts are work in progress …
-
This reply was modified 11 years, 6 months ago by simplex. Reason: Haha: that was obviously wrong: h1 = N * h0 (corrected now)
A good trader is a realist who wants to grab a chunk from the body of a trend, leaving top- and bottom-fishing to people on an ego trip. (Dr. Alexander Elder)
January 3, 2015 at 4:54 pm #3021but i think when a price recurred herself then she did! no difference in which timefarame she did it? didnot she? i dont know maybe i am in mistake .! but i believe if the price recurred herself on small timeframe then she has done it also on other time frames also !
January 3, 2015 at 5:56 pm #3022but i think when a price recurred herself then she did! no difference in which timefarame she did it? didnot she? i dont know maybe i am in mistake .! but i believe if the price recurred herself on small timeframe then she has done it also on other time frames also !
Sure, but from higher TF to lower TF.. and not in reverse because we don’t know if TZ from lower TF will become the lowest or highest top/bottom TZ for the rest higher TF..
But, if ‘she’ show up on higher TF then definitely it will also show up in lower TF.

Best Regards
MTH
Intuition, Experiences and Common sense..
http://www.binaryoptionsedge.com/January 3, 2015 at 7:17 pm #3035thankyou sir !
you are right
i meant the lower time frame candle one which be in the end of higher time frame candle! but i saw sometime it hasnot shown by indi!or shown sometimes as a fake TZ!-
This reply was modified 11 years, 6 months ago by aryafx.
January 4, 2015 at 12:51 am #3043Sure, but from higher TF to lower TF.. and not in reverse because we don’t know if TZ from lower TF will become the lowest or highest top/bottom TZ for the rest higher TF.. But, if ‘she’ show up on higher TF then definitely it will also show up in lower TF.
I think you should take the particular choice of h in both timeframes into account. Without knowing h in both timeframes I would not dare to define any rule about the relationship of TZ in those timeframes.
A good trader is a realist who wants to grab a chunk from the body of a trend, leaving top- and bottom-fishing to people on an ego trip. (Dr. Alexander Elder)
January 5, 2015 at 5:30 pm #3144Hi everyone, wish you an happy new year
Been following a lot of you on FF and Kiads since nearly his first posts on FF too. Hope that this community will grow and being protected by his members.
Kiads just a simple question about your TVI Indicator. Today I observed that the dots (green or red) appear several bars laters. Like a lag. Do you mind to explain a little bit how do you use it ?
Thanks for your help and time
January 5, 2015 at 5:46 pm #3145Hi everyone, wish you an happy new year Been following a lot of you on FF and Kiads since nearly his first posts on FF too. Hope that this community will grow and being protected by his members. Kiads just a simple question about your TVI Indicator. Today I observed that the dots (green or red) appear several bars laters. Like a lag. Do you mind to explain a little bit how do you use it ? Thanks for your help and time
Hi Brother, nice to see your post here…
Yes, TVI is lag indicator (the peak and valley markers). they will appear after 2 candles. We could use this TVI as our price cycle references (the MTF version), by looking at higher TF, and the markers will still effective in trending market (big cycle curve).
hope it help and best regards
MTH
Intuition, Experiences and Common sense..
http://www.binaryoptionsedge.com/January 5, 2015 at 8:12 pm #3148January 6, 2015 at 12:08 pm #3204yes kiad tvi should be first be checked on higher tf I have since been checking it since I uploaded and I came to notice that we can use your skull and star trading them on the side of higher tf tvi we should only take the one that says down if the tvi on higher tf says don too.i will upload the chart later but am still demoing.
January 6, 2015 at 2:23 pm #3213Good day everyone. I am a noob. The default setting for h is 21. Is h always 21? In another template I found that h was different for different time frame (h=16 for m15, h=8 for m30 and h=4for h1). In FF thread, FX-Jay’s h=30 which is quite usable for multi time frame. Sorry for my noob questions
January 6, 2015 at 2:45 pm #3216Good day everyone. I am a noob. The default setting for h is 21. Is h always 21? In another template I found that h was different for different time frame (h=16 for m15, h=8 for m30 and h=4for h1). In FF thread, FX-Jay’s h=30 which is quite usable for multi time frame. Sorry for my noob questions
Hi Brother, the length of h is relative to conditions..
but you could use common sense to select your h. The default setting h =21 is for Daily chart, as we know that 1 month trading days is around 21 days averagely.
M15 h=16, M30 h=8, and H1 h=4, meaning each wing forming 4 hours candle.. , so one TZ will has length of 8 hours or approximately 1 market session..
FX-Jay’s h=30 maybe reference to 1 week length of H4 candles, (4 hours x 30 = 120 hours = 1 week trading days). so his TZ length could be 2 weeks length.
Hope it help and best regards.
MTH
Intuition, Experiences and Common sense..
http://www.binaryoptionsedge.com/January 6, 2015 at 2:56 pm #3218Hi Brother, the length of h is relative to conditions.. but you could use common sense to select your h. The default setting h =21 is for Daily chart, as we know that 1 month trading days is around 21 days averagely. M15 h=16, M30 h=8, and H1 h=4, meaning each wing forming 4 hours candle.. , so one TZ will has length of 8 hours or approximately 1 market session.. FX-Jay’s h=30 maybe reference to 1 week length of H4 candles, (4 hours x 30 = 120 hours = 1 week trading days). so his TZ length could be 2 weeks length. Hope it help and best regards. MTH
Hi Kiads,
I got a stupid question to ask, if I’m using renko chart what’s the h value u r using for renko chart?
And I observe there’s no mid TZ in renko chart, am I correct?
And U take entry when its CTZ or still a PTZ?
Like ping pong entry?
I only know I know nothing
Skype: learnalways@outlook.comJanuary 6, 2015 at 5:29 pm #3237Hi Kiads,
Pls refer to attached pic. This happen on EURUSD no TZ is being marked maybe because h value is at 10. The arrows are iFractal by Saver0. The arrows looks good on Renko chart but abit messy(Period=6) on normal candlestick chart(maybe too short). If based on arrows and yr TVI higher TF we should just take long trade only. Only thing is might miss the setup because of no TZ appears. Pls advise. Thx. 2nd pic is h=16
-
This reply was modified 11 years, 6 months ago by LearnAlways.
-
This reply was modified 11 years, 6 months ago by LearnAlways.
-
This reply was modified 11 years, 6 months ago by LearnAlways.
Attachments:
You must be logged in to view attached files.I only know I know nothing
Skype: learnalways@outlook.comJanuary 6, 2015 at 6:32 pm #3262Hi Brother, the length of h is relative to conditions.. but you could use common sense to select your h. The default setting h =21 is for Daily chart, as we know that 1 month trading days is around 21 days averagely. M15 h=16, M30 h=8, and H1 h=4, meaning each wing forming 4 hours candle.. , so one TZ will has length of 8 hours or approximately 1 market session.. FX-Jay’s h=30 maybe reference to 1 week length of H4 candles, (4 hours x 30 = 120 hours = 1 week trading days). so his TZ length could be 2 weeks length. Hope it help and best regards. MTH
Hi Kiads, I got a stupid question to ask, if I’m using renko chart what’s the h value u r using for renko chart? And I observe there’s no mid TZ in renko chart, am I correct? And U take entry when its CTZ or still a PTZ? Like ping pong entry?
Hi Brother,
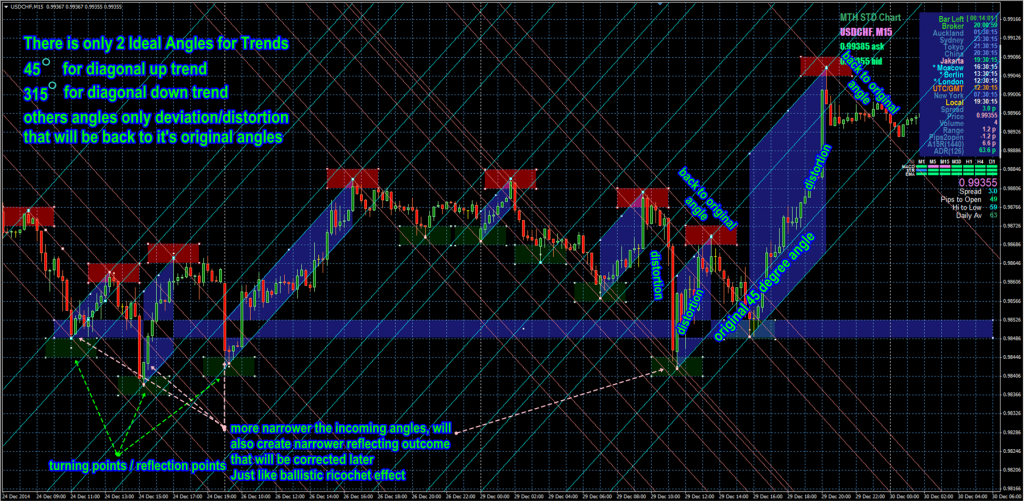
Since my renko chart default is my invented geo renko (1/8 th step of brick length that will create 45 / 315 degrees angles). So, 1 turning point from bullish brick to bearish brick v.v. will need 16 bricks or 32 bricks for complete cycle. so, for TZ in renko you can set your wing (h) as 8, 16 or 32, but I prefer 16. No matter the brick size, as long as you use 12.5% shift (the default) you could use this h=16 as your TZ length.
And, yes there’s no mid TZ since there’s no gap in geo renko chart.
When using TZ with my geo-renko, there always exact risk and reward ratio. h=16 ideal TZ wing, will give us 16 pips range minimum, and 24 pips when PTZ become CTZ.
From the beginning I learn this TZ concept and Sub Sequences concept, because this is highly related to my geo-renko concept..
If you put TZ Indi and my Star and Skull indicator to my geo-renko chart with brick size 8 pips and shift 12.5%, and only trade according to major trend direction.. with SL 8 pips and first TP 16 pips (RRR 1:2). I could assure that you will become consistently profitable trader..
Best Regards
MTH
Intuition, Experiences and Common sense..
http://www.binaryoptionsedge.com/January 7, 2015 at 5:12 am #3293Hi Kiads,
Happy New Year! I am using the SS indicator and have a question. I have placed 2 instances on a 4h chart one set to “current” and the other set to “1440 (daily)” with a different ID. I notice that there are many more daily SS instances than when it is on a daily chart set to current. Is there a reason for this behaviour or is the daily instance on the 4h chart placing indications at optimal points throughout the day? It appears to place the daily skull indi’s at same place as 4h candle skull indi.
Your guidance on this would be greatly appreciated my friend
regards
maahome
-
This reply was modified 11 years, 6 months ago by maahome.
January 7, 2015 at 5:28 am #3295Hi Kiads, Pls refer to attached pic. This happen on EURUSD no TZ is being marked maybe because h value is at 10. The arrows are iFractal by Saver0. The arrows looks good on Renko chart but abit messy(Period=6) on normal candlestick chart(maybe too short). If based on arrows and yr TVI higher TF we should just take long trade only. Only thing is might miss the setup because of no TZ appears. Pls advise. Thx. 2nd pic is h=16
Hi Brother, of course there will be no TZ at your marked area, bricks configuration at that area don’t has enough length for your h choice TZ.
btw, try to turn off timely brick (set to false) that create the parallel bricks, so you could get pure geo-renko chart.
TVI on renko chart will not so good, since tick volume data on renko chart is not so accurate..
Best Regards
MTH
Intuition, Experiences and Common sense..
http://www.binaryoptionsedge.com/January 7, 2015 at 5:33 am #3296Hi Kiads, Happy New Year! I am using the SS indicator and have a question. I have placed 2 instances on a 4h chart one set to “current” and the other set to “1440 (daily)” with a different ID. I notice that there are many more daily SS instances than when it is on a daily chart set to current. Is there a reason for this behaviour or is the daily instance on the 4h chart placing indications at optimal points throughout the day? Your guidance on this would be greatly appreciated my friend regards maahome
Hi Brother, Happy New Year too..
Yes of course, since on Daily chart SnS will look only complete daily candle to put ‘her’ signal, while on H4 chart, SnS will put ‘her’ signal on any H4 candles that confluence with signal on Daily Chart.
Hope it help and best regards
MTH
-
This reply was modified 11 years, 6 months ago by MTH2014.
Intuition, Experiences and Common sense..
http://www.binaryoptionsedge.com/January 7, 2015 at 5:57 am #3299Many thanks Kiads – I thought that would be the case but needed to check with the master :). Just so I am sure that I am doing it correctly, I have a daily chart (AUDUSD) that today show down skull and a 4 hr chart that has produced an up skull at 04:00. I then have another 4H chart with one instance set to “current” and one set to 1440 to place daily SnS on to it. The daily SNS chart is showing down but the chart with both time frames shows up signal on 4hr and the daily set also shows an up signal (it reads the same direction whenever the 4H prints a skull the daily setting does also).
I have attached a picture that shows the chart with the 4h indi in yellow and the daily in white you will see that always shows same as 4h skull (stars do not do this). This is showing an up skull for the daily (white) which on the daily chart is showing a down (skull chart attached)
Be well my friend
maahome
-
This reply was modified 11 years, 6 months ago by maahome. Reason: add image
Attachments:
You must be logged in to view attached files.January 7, 2015 at 6:31 am #3306Many thanks Kiads – I thought that would be the case but needed to check with the master :). Just so I am sure that I am doing it correctly, I have a daily chart (AUDUSD) that today show down skull and a 4 hr chart that has produced an up skull at 04:00. I then have another 4H chart with one instance set to “current” and one set to 1440 to place daily SnS on to it. The daily SNS chart is showing down but the chart with both time frames shows up signal on 4hr and the daily set also shows an up signal (it reads the same direction whenever the 4H prints a skull the daily setting does also). I have attached a picture that shows the chart with the 4h indi in yellow and the daily in white you will see that always shows same as 4h skull (stars do not do this). This is showing an up skull for the daily (white) which on the daily chart is showing a down (skull chart attached) Be well my friend maahome
Hi Brother, Just follow your Daily Chart. When there’s conflict signals between TF you should look at higher TF as reference. You may take the lower TF signal but should consider it, as ‘counter trade’ with tight SL and TP.
Hope it help and best regards.
MTH
Intuition, Experiences and Common sense..
http://www.binaryoptionsedge.com/ -
This reply was modified 11 years, 6 months ago by
- AuthorPosts
- You must be logged in to reply to this topic.