› Forums › General Discussions › Currency Strength
Tagged: currency strength
- This topic has 192 replies, 24 voices, and was last updated 1 year, 11 months ago by
 simplex.
- AuthorPosts
- March 4, 2015 at 3:59 am #5304
Thank you so much Kiads for the detailed explanation.
March 4, 2015 at 5:30 am #5306If you, MTH and me are swimming in the ocean with no land in sight – you can tell if you are getting closer or away from MTH and me, but you don’t know if we are getting nearer or away from the shore or our target.
That is relative or correlated distance between us, and it’s hard to measure because we are all in motion relative to one another.
If we had some fixed point, like a shore line or a beacon – which is fixed and static – we could measure each other fixed distance and speed toward or away from it.
Same thing with currencies – all 8 major currecies are related and in constant move from each other – without any “fixed” reference point that doesn’t move in tandem with them.
In order to measure correlated movement – you can use the standard “currency strenth” – there are several on the net, but they are not true “strength”, only correlated strength.
In order to find “true” currency strength you have to find some external, fixed, object that doesn’t move or influenced by those 8 currencies.
Using the “external” CNY is a good idea – but not all brokers offer those CNY pairs.
You can also use some fixed date/time where all currencies are start from 0 at that point.
G.
-
This reply was modified 11 years, 4 months ago by gg53.
March 4, 2015 at 10:43 am #5317If you, MTH and me are swimming in the ocean with no land in sight – you can tell if you are getting closer or away from MTH and me, but you don’t know if we are getting nearer or away from the shore or our target. That is relative or correlated distance between us, and it’s hard to measure because we are all in motion relative to one another. If we had some fixed point, like a shore line or a beacon – which is fixed and static – we could measure each other fixed distance and speed toward or away from it. Same thing with currencies – all 8 major currecies are related and in constant move from each other – without any “fixed” reference point that doesn’t move in tandem with them. In order to measure correlated movement – you can use the standard “currency strenth” – there are several on the net, but they are not true “strength”, only correlated strength. In order to find “true” currency strength you have to find some external, fixed, object that doesn’t move or influenced by those 8 currencies. Using the “external” CNY is a good idea – but not all brokers offer those CNY pairs. You can also use some fixed date/time where all currencies are start from 0 at that point. G.
Yes Brother that’s really correct.
For more universal calculation, instead of using CNY, you could also ‘anchoring’ the starting point from parity value. (1).. for example from open day time, we compare all the pairs involve with parity (1), and use the subtraction value as ‘current day starting ratio’ and the rest is comparing every movement values with that ratio to determine which currencies is the leading ‘trigger’ of market chain reaction. Later we could again use common ‘start’ like London Open or New York Open as our ‘ratio’ reset, so we also have ‘market season’ strength..
Best Regards
MTH.
Intuition, Experiences and Common sense..
http://www.binaryoptionsedge.com/March 4, 2015 at 3:19 pm #5323If you, MTH and me are swimming in the ocean with no land in sight – you can tell if you are getting closer or away from MTH and me, but you don’t know if we are getting nearer or away from the shore or our target. That is relative or correlated distance between us, and it’s hard to measure because we are all in motion relative to one another. If we had some fixed point, like a shore line or a beacon – which is fixed and static – we could measure each other fixed distance and speed toward or away from it. Same thing with currencies – all 8 major currecies are related and in constant move from each other – without any “fixed” reference point that doesn’t move in tandem with them. In order to measure correlated movement – you can use the standard “currency strenth” – there are several on the net, but they are not true “strength”, only correlated strength. In order to find “true” currency strength you have to find some external, fixed, object that doesn’t move or influenced by those 8 currencies. Using the “external” CNY is a good idea – but not all brokers offer those CNY pairs. You can also use some fixed date/time where all currencies are start from 0 at that point. G.
Yes Brother that’s really correct. For more universal calculation, instead of using CNY, you could also ‘anchoring’ the starting point from parity value. (1).. for example from open day time, we compare all the pairs involve with parity (1), and use the subtraction value as ‘current day starting ratio’ and the rest is comparing every movement values with that ratio to determine which currencies is the leading ‘trigger’ of market chain reaction. Later we could again use common ‘start’ like London Open or New York Open as our ‘ratio’ reset, so we also have ‘market season’ strength.. Best Regards MTH.
That’s EXACTLY what I’m doing in my “Spaghetti” currency strength. indie…
For maximum effectiveness avoid using “digital” view of strength and use good old lines, to effectivly view current direction. Reason: if the currency is “strong” and falling and a weak currency is rising – you might want to take the counter-trend position. with “digital” view you won’t see it.
Also, use numeric Rate-of-Change for each currency alongside the line. direction, by itself, is not an ultimate entry.
G.
March 4, 2015 at 3:35 pm #5324For more universal calculation, instead of using CNY, you could also ‘anchoring’ the starting point from parity value.
 Good point!
Resetting strength measures frequently to parity could be the solution. I really wasn’t feeling comfortable imagining to use a currency that’s permanently subject to heavy NB interventions as a common anchor.
Reset could happen daily or weekly, depending on TF and strategy chosen.
I’ll try that later this evening or tomorrow. Should be easy to implement.
Thanks, simplex
A good trader is a realist who wants to grab a chunk from the body of a trend, leaving top- and bottom-fishing to people on an ego trip. (Dr. Alexander Elder)
March 4, 2015 at 5:56 pm #5326For more universal calculation, instead of using CNY, you could also ‘anchoring’ the starting point from parity value.
Good point! Resetting strength measures frequently to parity could be the solution. I really wasn’t feeling comfortable imagining to use a currency that’s permanently subject to heavy NB interventions as a common anchor. Reset could happen daily or weekly, depending on TF and strategy chosen. I’ll try that later this evening or tomorrow. Should be easy to implement. Thanks, simplex…Try per session (London, London + NY, NY, Asian) and keep all 4 visible. You’ll see interesting, tradable, behaviour.
G.
March 5, 2015 at 12:50 am #5335Awesome! I love where we are headed! I will also work on a new indicator applying these principles and see what I can come up with. Would be really interesting to see what we all come up with and maybe make a super indicator combining the strengths from it all.
Focus, Patience, Determination & Order in chaos
March 5, 2015 at 2:41 am #5336Awesome! I love where we are headed! I will also work on a new indicator applying these principles and see what I can come up with. Would be really interesting to see what we all come up with and maybe make a super indicator combining the strengths from it all.
I already have one, but maybe you can teach an old dog some new tricks… The old dog is eager to learn… Wuff…Wuff…
G.
March 5, 2015 at 2:55 pm #5351As my first post.. i would like to thank Kiads, SaverO, gg53 for all that they do and for being so selfless..You guys ROCK!
 March 5, 2015 at 4:36 pm #5357
For more universal calculation, instead of using CNY, you could also ‘anchoring’ the starting point from parity value.
Good point! Resetting strength measures frequently to parity could be the solution. I really wasn’t feeling comfortable imagining to use a currency that’s permanently subject to heavy NB interventions as a common anchor. Reset could happen daily or weekly, depending on TF and strategy chosen. I’ll try that later this evening or tomorrow. Should be easy to implement. Thanks, simplexHi bro,
Lets say we have a “standard” currency strength indicator. How can we reset it for each session, without remove and attach it again to MT4 ? Any clue ?
Thanks in advance & for RSv4.6That’s EXACTLY what I’m doing in my “Spaghetti” currency strength. indie… For maximum effectiveness avoid using “digital” view of strength and use good old lines, to effectivly view current direction. Reason: if the currency is “strong” and falling and a weak currency is rising – you might want to take the counter-trend position. with “digital” view you won’t see it. Also, use numeric Rate-of-Change for each currency alongside the line. direction, by itself, is not an ultimate entry. G.
Thanks G. You are right, “digital” view can not say as much as old lines.
March 6, 2015 at 12:09 am #5372For more universal calculation, instead of using CNY, you could also ‘anchoring’ the starting point from parity value.
Good point! Resetting strength measures frequently to parity could be the solution. I really wasn’t feeling comfortable imagining to use a currency that’s permanently subject to heavy NB interventions as a common anchor. Reset could happen daily or weekly, depending on TF and strategy chosen. I’ll try that later this evening or tomorrow. Should be easy to implement. Thanks, simplexHi bro, Lets say we have a “standard” currency strength indicator. How can we reset it for each session, without remove and attach it again to MT4 ? Any clue ? Thanks in advance & for RSv4.6
That’s EXACTLY what I’m doing in my “Spaghetti” currency strength. indie… For maximum effectiveness avoid using “digital” view of strength and use good old lines, to effectivly view current direction. Reason: if the currency is “strong” and falling and a weak currency is rising – you might want to take the counter-trend position. with “digital” view you won’t see it. Also, use numeric Rate-of-Change for each currency alongside the line. direction, by itself, is not an ultimate entry. G.
Thanks G. You are right, “digital” view can not say as much as old lines.
You start your history FOR loop at some xx number of past bars (you can calculate according to TF if you want to set a specific date/time).
Each currency array start with a value of “0” at that starting point. The rest is up to the “standard” indie that you found and like.
You can use mini-charts to display several sessions or stop and start new at each session start. There are several examples to that in “Market Profile” indicator usage.
G.
March 6, 2015 at 12:25 am #5373Reading the latest ideas presented here yesterday, I realized that I had a very similar indicator made that captures some of this idea but I was using it differently before. I was using it to calculate the price of a basket of currencies.
After looking at it as if its the currency strength, looks like its able to predict the future movement really well. Here is a screenshot to begin with:

The red line is the new currency strength indicator and in green is the price. The strength here is a leading indicator telling me where the price should be.
Now to get to the interesting part of how the calculations were made. What I’m trying to do is get the price of USDCAD without using CAD and only use USD. As I just wrote this, made me think that I should also show on the chart the price of USDCAD without using USD. Let me get a screenshot of that and show it here as well.
And above is the same chart as from before but with the blue line showing the price of USDCAD without using USD.Think about that I said, the price of USDCAD without CAD and another without USD. I guess using the word price is a bit misleading because I’m calculating here isn’t the price, but pips. How many pips the currencies that doesn’t have CAD (for the first case) moved relative to the USD. And what I’m interesting in is the general direction to spot divergences. And this is how I would trade with this.
So how would I create a synthetic currency that is similar to USDCAD first without CAD. And then without USD? That’s the question

Here is another with EURJPY. Trade possibilities are everywhere it seems
Attachments:
You must be logged in to view attached files.Focus, Patience, Determination & Order in chaos
March 6, 2015 at 12:36 am #5377You start your history FOR loop at some xx number of past bars (you can calculate according to TF if you want to set a specific date/time). Each currency array start with a value of “0” at that starting point. The rest is up to the “standard” indie that you found and like. You can use mini-charts to display several sessions or stop and start new at each session start. There are several examples to that in “Market Profile” indicator usage. G.
Thanks a lot for your postS G. I will look at “Market Profile” too.
March 6, 2015 at 12:46 am #5379…. What I’m trying to do is get the price of USDCAD without using CAD and only use USD. As I just wrote this, made me think that I should also show on the chart the price of USDCAD without using USD. Let me get a screenshot of that and show it here as well. And above is the same chart as from before but with the blue line showing the price of USDCAD without using USD. Think about that I said, the price of USDCAD without CAD and another without USD. I guess using price is a bit misleading because I’m calculating here isn’t the price, but pips. How many pips the currencies that doesn’t have CAD (for the first case) moved relative to the USD. And what I’m interesting in is the general direction to spot divergences. And this is how I would trade with this.
This is great result brother. Could you please explain more ? How do you calculate “the price of USDCAD without CAD” ? And how to calculate “the price of USDCAD without USD” ?
Thanks in advance.March 6, 2015 at 7:56 am #5386 Anonymous
….
Hi saver0,
Very interesting!
Today, red news for CAD and USD.
So it must be interesting to see how your indicator behave before the news and after the news.
Thank you,
March 6, 2015 at 10:22 pm #5398Trade possibilities are everywhere it seems
Great Brother, Waiting for your next explanations..
Hopefully You could create powerful Ideal Indicator that could show ‘when’ it will happen and ‘where’ to go next..

Best Regards
MTH
PS. I failed to defending my 7 loss positions…thanks to NFP …lol
Don’t bother to look at the profit value is not USD, is only IDR.. hehehe..


Intuition, Experiences and Common sense..
http://www.binaryoptionsedge.com/March 6, 2015 at 10:42 pm #5399Trade possibilities are everywhere it seems
Great Brother, Waiting for your next explanations..
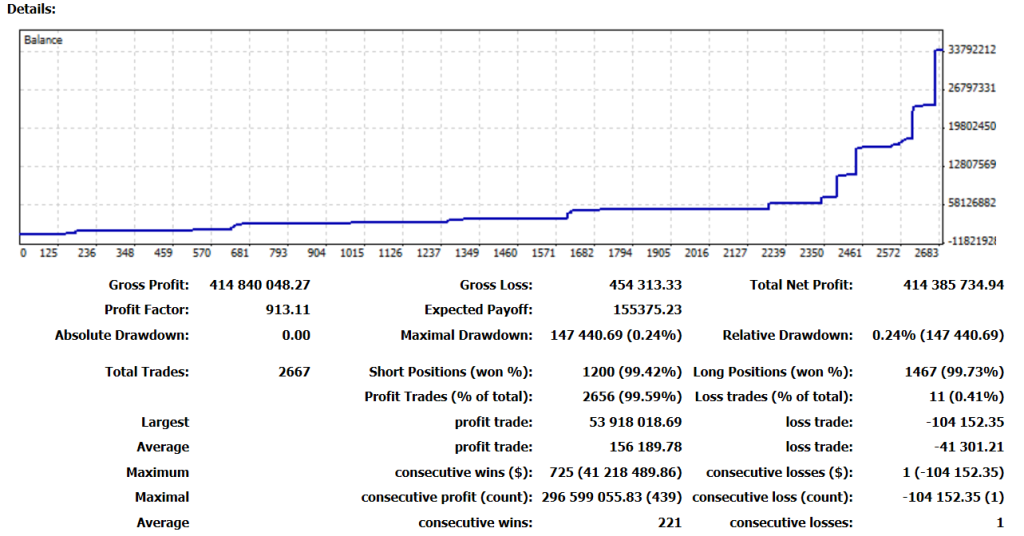
Hopefully You could create powerful Ideal Indicator that could show ‘when’ it will happen and ‘where’ to go next.. Best Regards MTH PS. I failed to defending my 7 loss positions…thanks to NFP …lol Don’t bother to look at the profit value is not USD, is only IDR.. hehehe.. Great result brother, congratulation. Profit > $33.000 is a very big value ….
March 6, 2015 at 11:02 pm #5400Profit trades 99.59%.!
 May God have us reach these numbers some day…
Nothing has ever motivated me more than this...
March 6, 2015 at 11:06 pm #5401I just fell of my chair, 2656 trades profit and 11 losses, 99.58% wow, never seen that before
 Nice Kiads.
I have been reading the thread over and over again, i must have not paying attention at kindergarden, i still dont see, how you get from an anchor to an profitable trade.
How do you split the currencypairs and connect to an anchor?, can you give another example ?
This is what i (think i) understand, you take dailyopen USDCNY, Normalize it, lets say 6.14669/10 = 0.614669
You take current bar of EURUSD, split the USD with :USDJPY/100 + Mathpow(EURUSD,-1) = 2 usd 1 jpy 1 eur – (Mathpow(EURJPY/100,-1)) /2 and compare it to de dailyopen to calculate the speed of usd.
Cheers.
-
This reply was modified 11 years, 4 months ago by martyw.
March 7, 2015 at 2:11 am #5405Don’t bother to look at the profit value is not USD, is only IDR.. hehehe..
Heh, I was trying to figure that out. Moving that much in USD with leverage seems like it would run into liquidity issues. …Though at the rate that you’re compounding returns, you will be testing these limits soon anyway!
I’ve been told that the equivalent of 10 lots can be moved at a time without much notice, but that large lot numbers like 50 or whatever would ‘attract too much attention’ from big players somehow. This might not be as much of an issue, right now, since you scale into trades. I’m interested in hearing what you learn, as this continues.
Your results are exciting and inspiring, brother. For that matter, everything from you and Saver0 and gg53 is inspiring, and helps me realize that I ought to move up from only knowing enough MQL to modify things, to knowing enough to create things that I haven’t seen before. Thanks to all of you.
March 7, 2015 at 3:22 am #5408Here is my ForexGT_Spaghetti indicator – which measure each individual currency strength (8 Majors).
Each currency have it’s own color – the CHF (grey) EUR (blue) and JPY (yellow) are currently highlighted.
Currency strength is one of the most predictive indicators available, if done correctly.
To illustrate this I posted the “not so obvious” trades posibilities – where I trade SHORT the strong currency and LONG the weaker currencies.
Pic#1 shows current situation, when CHF (grey) is the strongest currency, but starting to “fall”. The EUR (blue) and JPY (yellow) are weak, but starting to rise.
You can see it on the chart rightmost vertical red line.
At this position I trade SHORT CHFJPY and LONG EURCHF.
Results will follow…
G.
Attachments:
You must be logged in to view attached files.March 7, 2015 at 3:25 am #5410Eurovision 2015: “Here are the results of the Swiss jury: …”
G.
Attachments:
You must be logged in to view attached files.March 7, 2015 at 3:30 am #5413Eurovision 2015: “Here are the results of the Swiss jury: …” G.
For those of you who are trying to trade the “Cross” of two currencies:
It’s probably will be Ok, but “Crosses” are usually too late.
Trade should start with and when two currencies change position either against or away from one another.
G.
March 7, 2015 at 4:23 am #5414SaverO,
I wonder if you add standard deviation to the price it would help to indicate when it is too far from price.
March 7, 2015 at 11:43 am #5425Eurovision 2015: “Here are the results of the Swiss jury: …” G.
For those of you who are trying to trade the “Cross” of two currencies: It’s probably will be Ok, but “Crosses” are usually too late. Trade should start with and when two currencies change position either against or away from one another. G.
Thanks G, great. Have you a result, how many % probability that the strong currency will go up again after we see the “weakness” of it (CHF in this example)? In this case, after we see CHF will go down and EUR will go up, then we try to buy EUR/CHF. Because of we trading it before they cross each other (this will too late), it is possible that they will continue with its previous direction (CHF going up, EUR going down). Is it a rare event ?
Thanks in advance brother. -
This reply was modified 11 years, 4 months ago by
- AuthorPosts


- You must be logged in to reply to this topic.