› Forums › General Discussions › Currency Strength
Tagged: currency strength
- This topic has 192 replies, 24 voices, and was last updated 2 years ago by
 simplex.

- AuthorPosts
- March 7, 2015 at 2:18 pm #5427
Hi G.. Can you post a copy of your Spaghetti indi?
March 7, 2015 at 5:47 pm #5441Today, red news for CAD and USD. So it must be interesting to see how your indicator behave before the news and after the news.
This is what it looked like
 It’s pretty clear that USDCAD was set to go up even though on USDCAD itself was showing a ranging market the trend is a strong up trend.
As for the calculations, its nothing complicated. All I’m doing is trying to combine multiple pairs together. In the first case, combining the currencies that only has to do with USD and the other combining the ones that has to do with CAD.
USDCAD long means we are long on USD and short on CAD. That means to combine just the USD currencies together, I would say long on USDXXX currencies and short on YYYXXX currencies. This idea came to me from basket trading where we would trade a basket of currencies. But comibining currencies in this way, what I end up with is a similar synethetic currency that combined all of them BUT excluded USD or CAD. This way I can see how all the the other currencies are pulling or pushing USD or CAD in one direction or another. Think about this and see if you can create or come up with something that captures this idea.
-
This reply was modified 11 years, 6 months ago by Saver0.
Attachments:
You must be logged in to view attached files.Focus, Patience, Determination & Order in chaos
March 7, 2015 at 5:48 pm #5443Eurovision 2015: “Here are the results of the Swiss jury: …” G.
For those of you who are trying to trade the “Cross” of two currencies: It’s probably will be Ok, but “Crosses” are usually too late. Trade should start with and when two currencies change position either against or away from one another. G.
Thanks G, great. Have you a result, how many % probability that the strong currency will go up again after we see the “weakness” of it (CHF in this example)? In this case, after we see CHF will go down and EUR will go up, then we try to buy EUR/CHF. Because of we trading it before they cross each other (this will too late), it is possible that they will continue with its previous direction (CHF going up, EUR going down). Is it a rare event ? Thanks in advance brother.
Do the math:
There are 3 possible outcome for each currency movement: Down, Up, Flat
For 2 currencies you have 6 possible math outcome, 4/6 are in your favor or moving sideways.
In reality, I’ve never seen BOTH currencies reverse at the same time.
Furthermore, I don’t trade just based on this one – but with support of either Volatility, Momentum or Volume.
This ForexGT_Spaghetti is my “good morning” view (full screen, no price chart) of the WHOLE Forex market – what I should trade and what NOT to trade.
There is NOTHING more important than this, and there is nothing as predictive as a good “currency strength” that I came across.
G.
March 7, 2015 at 5:56 pm #5445This ForexGT_Spaghetti is my “good morning” view (full screen, no price chart) of the WHOLE Forex market – what I should trade and what NOT to trade.
So from the sounds of this, it sounds more like currency indexes than strength because you are actually not measuring strength but showing what it was and what it is now in terms of just price. Is that correct? Because strength would imply predictive capability. If USD is strongest and JPY is the weakest when speaking of strength, we would expect to take a long on USDJPY and be able to walk away being a winner.
This is what I was talking about with my first post. Let’s not get confused about strength vs indexes. We have to correct ourselves and label these indicators correctly because if not, they can be very misleading. We have a ton of currency index related indicators named as “currency strength” but its not showing strength, its just showing index prices of where price was and where it is now relative to the other currencies. At that point, its just like looking at the price of USD or EUR or JPY, etc. Our brains have to guess which one will be stronger vs weaker. It’s not any better than just looking at a currency pair to me.. honestly I think just looking at the pair at that point is superior to looking at these index indicators. If USD is weak and EUR is weak in a so called “currency strength” indicator, I guarantee that it will be flat in EURUSD chart.. we have no idea which one is truly strong or weak and to which way it will break out. My focus here to find the strength, to measure the strength and to be able to predict which way these currencies would break out when they look flat in these “currency index” indicators.
Focus, Patience, Determination & Order in chaos
March 7, 2015 at 7:34 pm #5449This ForexGT_Spaghetti is my “good morning” view (full screen, no price chart) of the WHOLE Forex market – what I should trade and what NOT to trade.
So from the sounds of this, it sounds more like currency indexes than strength because you are actually not measuring strength but showing what it was and what it is now in terms of just price. Is that correct? Because strength would imply predictive capability. If USD is strongest and JPY is the weakest when speaking of strength, we would expect to take a long on USDJPY and be able to walk away being a winner. This is what I was talking about with my first post. Let’s not get confused about strength vs indexes. We have to correct ourselves and label these indicators correctly because if not, they can be very misleading. We have a ton of currency index related indicators named as “currency strength” but its not showing strength, its just showing index prices of where price was and where it is now relative to the other currencies. At that point, its just like looking at the price of USD or EUR or JPY, etc. Our brains have to guess which one will be stronger vs weaker. It’s not any better than just looking at a currency pair to me.. honestly I think just looking at the pair at that point is superior to looking at these index indicators. If USD is weak and EUR is weak in a so called “currency strength” indicator, I guarantee that it will be flat in EURUSD chart.. we have no idea which one is truly strong or weak and to which way it will break out. My focus here to find the strength, to measure the strength and to be able to predict which way these currencies would break out when they look flat in these “currency index” indicators.
ForexGT_Spaghetti is a “Currency Strength” based – not index and not correlation.
It is not based on price only – but on Volume, Momentum, Market share, and ROC (Rate of Change) – of each individual currency.
It is very much like the Dollar index, which takes into account USD relative to a basket of foreign currencies (not all of them are the other 7 majors) – but calculated differently (not just geometrical mean).
In order to show them together we are scaling each one to fit in one indie.
“Anchoring”, as MTH call it, is done by date/time. Either @GMT, London Open, or per session start.
There are no “crosses” pairs involved in the calculations – because, as already explained, they introduce unneccessary “noise” to the end result.
G.
March 7, 2015 at 8:27 pm #5450Per your request:
Market is “Flat” in both conditions (rightmost vertical line).
Can we “predict”, based on USD (green) and GBP (red) direction – where the market is going?
Results will follow…
G.
Attachments:
You must be logged in to view attached files.March 7, 2015 at 8:30 pm #5453The results (for those who “guessed” correctly…):
G.
Attachments:
You must be logged in to view attached files.March 7, 2015 at 10:37 pm #5458Market is “Flat” in both conditions (rightmost vertical line). Can we “predict”, based on USD (green) and GBP (red) direction – where the market is going?
Can you show me the result of the following [ GBP (red) – USD (green) ]. I bet it will look just like GBPUSD, hence it being a index based indicator and not strength. Also I don’t see anything other than what I see in the chart already. When both are flat, the currency is flat, only when one is increasing and the other is decreasing is it moving. Looks to me like a typical currency index indicator. Here is the same chart with the popular very simple CC indicator (attached if anybody wants to download it). Looks almost identical doesn’t it?
And if you take the difference [ GBP (red) – USD (green) ] you would end up with a line that is identical to GBPUSD. At the end, its not showing me anything useful or more because when GU is flat, guess what, thats when Red and Green is flat. When GU is going up, thats when Red is increasing and Green is decreasing. It’s exactly as if you were to trade based on the slope of the MA of GBPUSD. Going long when slope is up and short when slope is down. Is that really currency strength? I mean sure, if you call that currency strength thats fine, its up to you. To me that’s not currency strength, that’s an index.
Here I think is the only way to define currency strength.. when GBPUSD is ranging without a clear direction, currency strength should tell me which of the two is the strongest. Therefor telling us which direction to take the trade. When GBPUSD is trending higher, currency strength should tell me when GBP strength is ending and USD strength is picking up before it turns.Anyways, I’m not here to have an endless debate on whether or not gg’s indicator is a currency strength or currency index indicator since I haven’t even seen the code nor do I know how it works. So there is no point in debating over it. My goal is to create a currency strength indicator and not another index indicator since I find them to be inferior and confusing compared to the pure price chart (and I’m sure some will disagree).
So how can we create an indicator that can tell me when the market is ranging which of the two is stronger and when its trending, when that trend is about to change? Is that even possible to make? haha
Attachments:
You must be logged in to view attached files.Focus, Patience, Determination & Order in chaos
March 7, 2015 at 10:55 pm #5461I’m not sure if this is just a coincidence but this is what my indicator seem to have shown for USDCAD before the huge long spike.. Pretty difficult to imagine..
If this is not a coincidence, this is exactly what I would want a currency strength indicator to show, when the market is flat, to which direction all the other currencies are pulling the pair really towards. I will test more and report.
Attachments:
You must be logged in to view attached files.Focus, Patience, Determination & Order in chaos
March 7, 2015 at 11:00 pm #5463Market is “Flat” in both conditions (rightmost vertical line). Can we “predict”, based on USD (green) and GBP (red) direction – where the market is going?
Can you show me the result of the following [ GBP (red) – USD (green) ]. I bet it will look just like GBPUSD, hence it being a index based indicator and not strength. Also I don’t see anything other than what I see in the chart already. When both are flat, the currency is flat, only when one is increasing and the other is decreasing is it moving. Looks to me like a typical currency index indicator. Here is the same chart with the popular very simple CC indicator (attached if anybody wants to download it). Looks almost identical doesn’t it? And if you take the difference [ GBP (red) – USD (green) ] you would end up with a line that is identical to GBPUSD. At the end, its not showing me anything useful or more because when GU is flat, guess what, thats when Red and Green is flat. When GU is going up, thats when Red is increasing and Green is decreasing. It’s exactly as if you were to trade based on the slope of the MA of GBPUSD. Going long when slope is up and short when slope is down. Is that really currency strength? I mean sure, if you call that currency strength thats fine, its up to you. To me that’s not currency strength, that’s an index. Here I think is the only way to define currency strength.. when GBPUSD is ranging without a clear direction, currency strength should tell me which of the two is the strongest. Therefor telling us which direction to take the trade. When GBPUSD is trending higher, currency strength should tell me when GBP strength is ending and USD strength is picking up before it turns. Anyways, I’m not here to have an endless debate on whether or not gg’s indicator is a currency strength or currency index indicator since I haven’t even seen the code nor do I know how it works. So there is no point in debating over it. My goal is to create a currency strength indicator and not another index indicator since I find them to be inferior and confusing compared to the pure price chart (and I’m sure some will disagree). So how can we create an indicator that can tell me when the market is ranging which of the two is stronger and when its trending, when that trend is about to change? Is that even possible to make? haha
You have the GBPUSD on chart.
Yeah, Ok… It’s an index… whatever…
Try to mimic GBPUSD price and you’ll get different results, but you know best…
BTW: no matter what the indie tells you, without volume price action will go nowhere.
I’ll stick to this shitty “price” indie…
G.
March 7, 2015 at 11:00 pm #5464Maybe its not just a coincidence.. this is the first time I have looked at it from a M5 chart. This speaks of the amount of time I have for forex development these days.. haha
Attachments:
You must be logged in to view attached files.Focus, Patience, Determination & Order in chaos
March 7, 2015 at 11:11 pm #5466You have the GBPUSD on chart.
I don’t understand.. I showed your chart and then underneath the CC “currency strength” indicator which looks very much identical to yours. And that one is based on the simple MA and no complex calculations involving volume or anything.
Also in forex, there is no volume. Good luck finding volume. Do you think the actual central bank and big player volume (those of who actually move the market) would show up at a broker or anywhere as ticks? It won’t. With my experiments, the volume is 95% similar to the spread of a bar (High-Low). In other words, volume is like measuring the High-Low of a bar.
Please don’t get upset at me for speaking about these for what they are. I’m intending to put things in its proper place so we can build something different and not be thinking along the line of the old way of building indexes. Like you said, at the end, its whatever we call them, call yours the holy grail indicator if we wish and refer to it as you wish. There already is an indicator that calls itself a holy grail indicator though.. haha
If the indicator cannot predict the turning points then to me its not important because naked chart is all I need. I don’t expect others to agree with me. I’m simply stating what’s useful to me and what’s not. What I find useful is not what you or anybody else will find useful. In this thread, I want to discuss currency strength.. sure call it index, its fine.. but expect me to speak my mind and say if I think something looks more like an index than strength. I’m here to learn from you as much as you are here to learn from me. Let’s share and see if we can make something new together
 Hope no hard feelings..
Focus, Patience, Determination & Order in chaos
March 7, 2015 at 11:21 pm #5467Here you can “play” the LONG GBP against everyone else, before price action.
BTW: another subjct: I already found volume, take a look at KIAD’s TickVolume.
G.
Attachments:
You must be logged in to view attached files.March 7, 2015 at 11:30 pm #5469Naked chart IS an indicator !
Do you think that banks look at the same chart as yours? when was the last time you visited a major bank trading room?
As to different opinions on something: that’s perfectly Ok with me. What makes me wonder about others opinion is how they come to “definit” conclusion of things are built or constructed without knowing how they are actualy built.
Following this way of thinking might lead me to believe that each flying bird must have a Boeing engine up her ass…
G.
March 7, 2015 at 11:43 pm #5470Take a closer look – cc you posted is not the same…
Look at the far left when in mine GBP crosses the USD and yours doesn’t, and a bunch of other diffs…
G.
March 8, 2015 at 1:20 am #5473Take a closer look – cc you posted is not the same… Look at the far left when in mine GBP crosses the USD and yours doesn’t, and a bunch of other diffs… G.
The two charts are not exactly lined up over each other. Compare by using the candles where they cross.
March 8, 2015 at 3:19 am #5477Naked chart IS an indicator ! Do you think that banks look at the same chart as yours? when was the last time you visited a major bank trading room? As to different opinions on something: that’s perfectly Ok with me. What makes me wonder about others opinion is how they come to “definit” conclusion of things are built or constructed without knowing how they are actualy built. Following this way of thinking might lead me to believe that each flying bird must have a Boeing engine up her ass… G.
Hi gg53,
Do u mind explaining what do u mean by
Q1) Naked chart IS an indicator !
Q2) And what charts does the banks see?
Thanks & Best Regards,
LearnAlways
I only know I know nothing
Skype: learnalways@outlook.comMarch 8, 2015 at 3:09 am #5482March 8, 2015 at 3:23 am #5486Just Adding ‘spicy’ to this great discussion… MTH
Hi Brother,
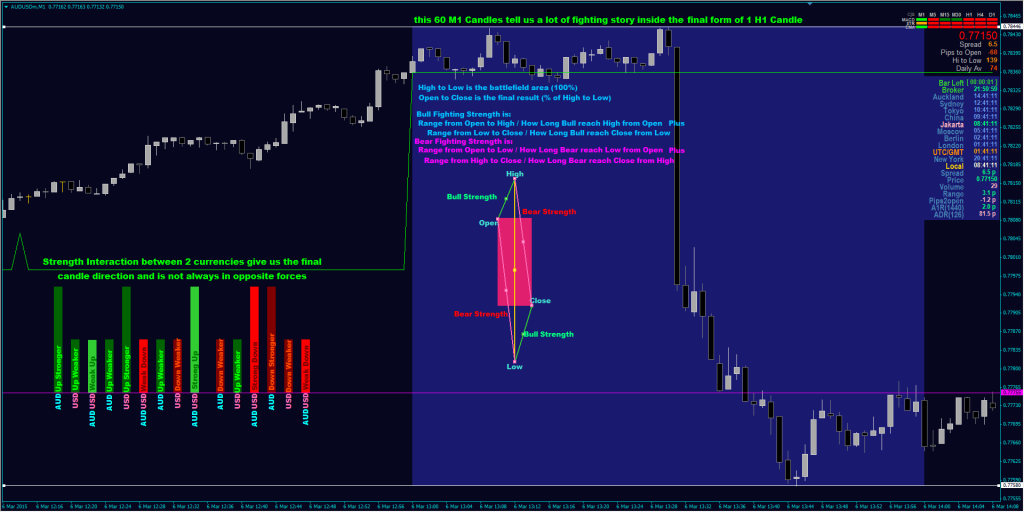
There are like 15 states of price strength as what u posted. I mean its almost like what CrucialPoint said there’s actually 6 state of price. So how do we use this info? Create a currency strength indicator based on 15 states???
I only know I know nothing
Skype: learnalways@outlook.comMarch 8, 2015 at 3:27 am #5487Naked chart IS an indicator ! Do you think that banks look at the same chart as yours? when was the last time you visited a major bank trading room? As to different opinions on something: that’s perfectly Ok with me. What makes me wonder about others opinion is how they come to “definit” conclusion of things are built or constructed without knowing how they are actualy built. Following this way of thinking might lead me to believe that each flying bird must have a Boeing engine up her ass… G.
Hi gg53, Do u mind explaining what do u mean by Q1) Naked chart IS an indicator ! Q2) And what charts does the banks see? Thanks & Best Regards, LearnAlways
Just my own personal Opinion;
Naked chart IS an Indicator…
Yes, 100% correct.. What you see in your retail trading platform whatever is candlestick chart, line chart, bar chart, renko chart, constant range bar chart,kagi chart, point and figure chart, mountain chart, tick chart, 3 line break chart, etc.. are visualization attempt of what happen in the market interaction that actually the ‘real one’ is only flow of ‘high speed’ numbers back and forth..
Unfortunately, what ‘at last’ we could see in our platform screen is the result of so many ‘previously distorted’ data feed, so this is also could answer the 2nd question, what the bank treasury floor trade room trading screen displayed is not the ‘above’ end user/retail trader charts, but order flow positions that ‘flashing’ in nano seconds..
But please don’t take my words… read my signature I’m noob as usual….
Best Regards
MTH
Intuition, Experiences and Common sense..
http://www.binaryoptionsedge.com/March 8, 2015 at 3:37 am #5488Just Adding ‘spicy’ to this great discussion… MTH
Hi Brother, There are like 15 states of price strength as what u posted. I mean its almost like what CrucialPoint said there’s actually 6 state of price. So how do we use this info? Create a currency strength indicator based on 15 states???
No Brother, that only visualization example of strength interaction between two currencies in pair to create final form of direction bias. In the OHLC format of information, the summary of all these interactions is only 2 state (from the movement point of view).
1. from Open goes to High first, then to Low and then to Close that mean, 2 up 1 down.
2. from Open goes to Low first, then to High and then to Close that mean, 2 down 1 up.
No matter the final form of OHLC is Bullish candle or Bearish candle, the movement summary is only that ‘two’ formations.
Hope You Understand and Best Regards
MTH
-
This reply was modified 11 years, 6 months ago by MTH2014.
Intuition, Experiences and Common sense..
http://www.binaryoptionsedge.com/March 8, 2015 at 3:41 am #5490Naked chart IS an indicator ! Do you think that banks look at the same chart as yours? when was the last time you visited a major bank trading room? As to different opinions on something: that’s perfectly Ok with me. What makes me wonder about others opinion is how they come to “definit” conclusion of things are built or constructed without knowing how they are actualy built. Following this way of thinking might lead me to believe that each flying bird must have a Boeing engine up her ass… G.
Hi gg53, Do u mind explaining what do u mean by Q1) Naked chart IS an indicator ! Q2) And what charts does the banks see? Thanks & Best Regards, LearnAlways
Just my own personal Opinion; Naked chart IS an Indicator… Yes, 100% correct.. What you see in your retail trading platform whatever is candlestick chart, line chart, bar chart, renko chart, constant range bar chart,kagi chart, point and figure chart, mountain chart, tick chart, 3 line break chart, etc.. are visualization attempt of what happen in the market interaction that actually the ‘real one’ is only flow of ‘high speed’ numbers back and forth.. Unfortunately, what ‘at last’ we could see in our platform screen is the result of so many ‘previously distorted’ data feed, so this is also could answer the 2nd question, what the bank treasury floor trade room trading screen displayed is not the ‘above’ end user/retail trader charts, but order flow positions that ‘flashing’ in nano seconds.. But please don’t take my words… read my signature I’m noob as usual…. Best Regards MTH
Hi Brother,
Do u mind elaborating “order flow positions that ‘flashing’ in nano seconds”, thanks.
I only know I know nothing
Skype: learnalways@outlook.comMarch 8, 2015 at 4:19 am #5491Naked chart IS an indicator ! Do you think that banks look at the same chart as yours? when was the last time you visited a major bank trading room? As to different opinions on something: that’s perfectly Ok with me. What makes me wonder about others opinion is how they come to “definit” conclusion of things are built or constructed without knowing how they are actualy built. Following this way of thinking might lead me to believe that each flying bird must have a Boeing engine up her ass… G.
Hi gg53, Do u mind explaining what do u mean by Q1) Naked chart IS an indicator ! Q2) And what charts does the banks see? Thanks & Best Regards, LearnAlways
Just my own personal Opinion; Naked chart IS an Indicator… Yes, 100% correct.. What you see in your retail trading platform whatever is candlestick chart, line chart, bar chart, renko chart, constant range bar chart,kagi chart, point and figure chart, mountain chart, tick chart, 3 line break chart, etc.. are visualization attempt of what happen in the market interaction that actually the ‘real one’ is only flow of ‘high speed’ numbers back and forth.. Unfortunately, what ‘at last’ we could see in our platform screen is the result of so many ‘previously distorted’ data feed, so this is also could answer the 2nd question, what the bank treasury floor trade room trading screen displayed is not the ‘above’ end user/retail trader charts, but order flow positions that ‘flashing’ in nano seconds.. But please don’t take my words… read my signature I’m noob as usual…. Best Regards MTH
Hi Brother, Do u mind elaborating “order flow positions that ‘flashing’ in nano seconds”, thanks.
Brother, You may look at wikipedia for further information and explanations. Maybe start with ‘trading room’ for search key…
MTH
Intuition, Experiences and Common sense..
http://www.binaryoptionsedge.com/March 8, 2015 at 5:27 am #5492order flow positions that ‘flashing’ in nano seconds
Hi Brother,
I goggle but mostly just words explanation. Nothing useful I can find. Is it something like brokers able to see how many lots sizes are at a particular price level?
Hopefully more info is available how the banks trade?
I only know I know nothing
Skype: learnalways@outlook.comMarch 8, 2015 at 5:57 am #5494Just recap from one of my trading seminar session, one trader instructor touch on trading room topic….he asked the audience to google search “trading room” pictures….look at all the screens in the pictures….ask us a question “do you always see a lot of different indicators in the screen?”
Maybe thats why currency index/strength is what the traders look at…..just some thoughts
-
This reply was modified 11 years, 6 months ago by
- AuthorPosts


 It’s pretty clear that USDCAD was set to go up even though on USDCAD itself was showing a ranging market the trend is a strong up trend.

 Hope no hard feelings..




- You must be logged in to reply to this topic.