
Forum Replies Created
- AuthorPosts
This reply has been reported for inappropriate content.
Hi All,
It is a loooong time … want to wish you all the great penguins : Happy 4 year !!

Wish you all a very Merry Christmas 2018 & Happy New Year 2019 … may this coming year brings you all green pips !!
This reply has been reported for inappropriate content.
Hi all best friends …
Wish you all a Merry Christmas 2017 & a very successful New Year 2018 !!!
This reply has been reported for inappropriate content.
[delete] posted at wrong thread … sorry
This reply has been reported for inappropriate content.
yes, that’s from the loss management. Even though there were 2 losses, the overall trade ended up in a profit. That was from 2 rare events happening one after the other. There is still a LOT of work to be done before this can have any use….
Thank you so much for relaying those answers LearnAlways! From this response, I can say what FX-Jay is doing makes perfect sense. To restate what you stated, he is trading: 1) Towards the trend. 2) Towards a PTZ once a TZ is formed. Now ask yourself why would this very simple method work? We know that a TZ gets formed when a certain time interval (H) has expired. This means the “retracement” is complete. …
These are interesting information saver0 … But trading by targeting RZ area as a reversal / pullback method is common in trading, and it is also well known that this reversal idea can be dangerous if we do not get the Right entry point, the draw down we get can be very very Big .. And as Eurusdd always said, we must choose the Right H value to get best result using transient / recurrent zone. Some times we must be very patient too, waiting our target to be hit (this because of the H value we choose). Although the win probability we can get is Big enough using this setting, the very large draw down can blow up our account, so the entry timing is very important here. If we use momentum indicator (instead of using repainting ZZ and its derivative versions) at lower TF (for example: @M1 ) , is it not too late for our entry ? Do you have statistic on this setup : how big is the draw down if we trade without SL, and is it a good idea to take all signal we can get using this setup ? Do you trade other instrument beside Forex (ex: stocks), and can this transient zone / recurrence zone idea be applied to stocks ?? Any clue / idea / advice / tools to avoid this draw down is really appreciated … Gracias !
Hola, … you train your model using historical data and you might end up with a solution that works perfectly for your training data but fails miserably when applied to new and still unseen data. This problem is well known as over fitting. Typically, you would want to retrain your model from time to time as its predictive power decreases. So far, so good. Another probem using suchlike models/filters is their lagging nature. What I mentioned in my thread is basically an alternative optimization criterion for finding model coefficients. It is a variant of the MSE where you can weight some components of the error individually. …
Addition regarding p: this is a hyperparemeter you have to define in advance before learning the parameters and will influence the depth of considered data history (memory/model size). A complex model can capture complex signal characteristics but is also more prone to overfitting compared to smaller model sizes. Generally, you want p to be as small as possible while still maintaining predictive power. So, p itself might be subject to an optimization process.
These are great information Flx23
 . i though before, that p must be much much bigger than the normal period we take (around 1.5x to 10x bigger), i think i get it now… it is for other purpose.
Gracias
Hola … buenos dias,
I see a good thread here : https://penguintraders.com/forums/topic/for-the-friends-of-cultivated-filtering/ , i think it has relationship to my problem, but there is some different than the one i will ask. Lets say i want to do a prediction (aka extrapolation), how to do it ? If i read this post : http://math.tutorvista.com/calculus/extrapolation.html , the formula is given by :y(x)=y1 + (x-x1) (y2−y1) / (x2 – x1)
Where the two end points of linear graph are : (x1, y1) and (x2,y2) , and the value of the point x is to be extrapolated…
If i am not mistaken, it is only for linear extrapolation with 2 points. If we apply this formula to our charts, and take just 2 last points (lets say 2 last closing prices), it will not represent the whole picture. How about using prediction model as described here ? https://en.wikipedia.org/wiki/Linear_prediction

But … how many points we need for the value “p” (for i=1 to i=p) ? And how to calculate the predictor coefficients
? I don’t think that we need Kalman filter here, right ? Any idea ? Gracias-
This reply was modified 8 years, 9 months ago by
 despacito.
This reply has been reported for inappropriate content.
@despacito: Eurusdd wrote:
For example, suppose you chose your reals to be high of bars. The on the daily chart of you set n=2 then you need to look in the DNA for 5 bars. Let us suppose the highs of the last 4 bars are 1.2344, 1.2566, 1.2211, 1.2222, ????? What will be ????? Since there must be a decreasing or increasing 3-subsequence, the high of the next bar must be above 1.2522 or below 1.2211. Just two options.
…..
And here is my interpretation (although Eurusdd seems to see it different since he said that we just have to look for the highest and the lowest number of our four numbers): Since in 93.75 % one of the four conditions should be fulfilled we can bet that the 5th number, x5, is either smaller than 1.2211 (this would fulfill the condition (ii)) or that x5 is bigger than 1.2222 (this would fulfill (iv)). However, if I want to predict a future direction, I’m just looking for the cases where the two numbers in (ii) and (iv) (that are x1 and x3 or x3 and x4) suggest an identical direction (either < < or > > in both cases). Moreover, if I want to predict the high of x5, I would only take the predictions where both partly conditions gave < <, thus that the outcome is higher than max(x3, x4). But once again, this doesn’t work since the premise of this subsequence theorem is that the numbers (opens, highs, lows, closes, etc.) are random numbers with an equal chance of being higher or lower than the previous numbers …
Great information Anti. very clear like a crystal ball … really appreciate it.
Muchas Gracias, D.Attachments:
You must be logged in to view attached files.This reply has been reported for inappropriate content.
Hi Anti, This is great, very interesting … but i am new, so i have some questions if you don’t mind …. a) Regarding your link to FF , i am not sure there is a typo or it is indeed right about the price above 1.2522 (is it Not 1.2566 ??)
 “… the high of the next bar must be above 1.2522 or below 1.2211. Just two options.… ” ???
yes, it was a typo of EURUSDD, see here.
b) Regarding the High/Low.Close/Open price , is it Not the mean/average price, right ? Any clue on these ??
In theory you could use any prize characteristics. I think it was @mth2014 (aka Kiads) who found that for OHLC4 the relative frequency is even higher. However, I still can’t see how we can use it in order to predict a prize direction. My stats on dependent probabilities* have shown that there’s no edge. (* What matters is the relative frequency of an correct predicted outcome, where the prediction is based on the condition which fulfills x1>x3>x5 and x3>x4>x5, where x1>x2>x3 and x2>x3>x4 hasn’t been fulfilled). Regarding your other post: I’ve exported the EURUSD data from my MT4’s history center. Still didn’t have the time/muse to experiment with MT4-R-Interfaces. Regarding the image for h = 50 … It says that on average all prizes within a range of 101 candles (50 to the left, 1 mid-bar, 50 to the right) will be hit by about 17 candles. The probability for (0)-recurrent prizes is smaller than 2 %. However, if a prize has been hit more than 40 times (for instance, in 50 candles), then the probability that the prize will be hit again within the remaining 51 candles is less than 5 %.
Hi Anti,
a) Thank you for your information about R and how you did it.
b) Regarding the typo (1.2522 => 1.2222), i am still confused as i read this : “Find the highest and lowest value in your set. The number you are interested in should be above the highest or below the lowest value! “. If we define X1=1.2344, X2=1.2566, X3=1.2211, X4=1.2222 , and current candle is the X5. If current bar must not be included in the set, then the lowest value = 1.2211 and highest value = 1.2566 (X2). But if current bar Must be included in the set, we get 2 linear SS ended with X5: X1-X3-X5 and X3-X4-X5. From these 2 subsets, the lowest value is 1.2211 (X3) and the highest value is 1.2344 (X1). So, the highest value in the subset is : 1.2566 (X2) or 1.2344 (X1) depend on if we Must include current bar or not in the subset. This is not the 1.2222 value as he corrected … Or may be he means some thing else ?
cfdtaleong’s post is also interesting for me , still trying to understand the whole …c) I think i get clue why Kiads distinguish between Skull and star. In term of similarity, the failure is defined as DS and the similarity must be restored, and in term of TRZ, 97% of price are recurrent , and we are hoping for the revisit (in the future). There is similarity here in term of SS if i am not wrong … next i must look up to the sky, expecting the bright light of the Stars shines on me ….

Gracias, D.
This reply has been reported for inappropriate content.
Ok, here are some of the results. I’ve used the same terminology as in my above post (a (0)-recurrent event represents transient prizes). For each candle in the EURUSD H1 history I’ve counted how often each prize has been hit h bars before or after the mid-candle (problem bar). Here are some results for h in {5, 25, 50}:
 With these empirical cumulative distribution functions we can now calculate the probability for seeing a
 (l)-recurrent event becoming at least a(l+1)event. However, this calculation is based on the assumption that the market is completely random. Thus, in the short run the ‘observed’ probabilities can deviate slightly … Here’s the R code used for calculation of empirical probability distributions:eu <- read.csv(“C:/Users/Daniel/Desktop/EURUSD60.csv”) colnames(eu) <- c(“date”,”time”,”open”,”high”,”low”,”close”,”volume”) head(eu) attach(eu) h = 5 recur <- NULL for (i in (h+1):(dim(eu)[1]-h)) { prize <- seq(from=low,to=high,by=0.00001) for (j in 1:length(prize)) { recurrence <- 0 for (k in (i-h):(i+h)) { if (prize[j]>=low[k] && prize[j]<=high[k]) { recurrence <- recurrence + 1 } } recur <- c(recur,recurrence) } print(i) } h5 <- recur-1 h25 <- recur-1 h50 <- recur-1
Wow, nice result @Anti.
a) About the R, how do you get the candle information ? Do you get it directly from MT4 platform (some thing like R+MT4 bridge) ? Or, do you import the candles data from MT4 to your database, and then do calculation using R based on that (so to say, it is R+Mysql / MsSql bridge) ?
b) Regarding the result, can you explain more about the chart ? What does it mean actually ? Lets see the last image, for h=50. At X axis, we have number of (i) recurrence from 0 to 100, and on Y axis, we have cumulative density function from 0 to 1. The curve of h=50 will be almost flat (around = 1 for cumulative density function, after the recurrence reach >= 50 , it is same as the h_value itself ). If the value of (i) recurrence = 0, it means that it is transient zone, this is clear. But i do not understand about this “we can now calculate the probability for seeing a (l)-recurrent event becoming at least a (l+1) event ” ….
Can you explain more ? Sorry for asking too much, i am a newbie … (i hope this is not a silly question
 )
)Muchas gracias por adelantado, D.
-
This reply was modified 8 years, 10 months ago by despacito.
This reply has been reported for inappropriate content.
You’re good, @flx23. The main assumption of the theorem was that prize is generated by a stochastic process that gives equal chances for any candle to be either an up or down candle (or having higher highs/lows than the previous candle). However, in his post (see the delivered quotation here) Eurusdd presumes that the probability is shifted whenever two out of the four conditions aren’t met. But indeed, the probability for the last of five values (where the first four have been realized) is still 0.5. Thus. prize will do what it wants to do. However, if you go through the prize history and analyze each chunk of 5 candles in regards to OHLC, then you’ll see that about 93.75 % of these 5-chunks fulfill at least one of the four conditions (see image here). That may mean that prize resembles the output of a stochastic process that has been initially assumed. If you are able to trade with the info that there is at least one increasing or decreasing subsequence in a set of 5 candles, then you may find this theorem useful (however, I couldn’t make any use of it). Another way to use the subsequence idea to your advantage is to count the number of fulfilled increasing/decreasing subsequences within each 5-chunk and use it as a trend-following tool. The beauty of the subsequence theory is that you can always study historical (sub)sequences that are anchored in the most recent (the last) candlestick. Nevertheless, the more time I investigated to find anything useful in Eurusdd’s theories, the more I come to the conclusion that they are merely useless. Maybe they may work with a different interpretation. I conclude that the main reason why some are able to trade this profitable lies within hedging and/or money management. But if you don’t agree with me, please feel free to convince me … Otherwise I’ll stop my research here (have a lot of other research to do).
Hi Anti,
This is great, very interesting … but i am new, so i have some questions if you don’t mind ….
a) Regarding your link to FF , i am not sure there is a typo or it is indeed right about the price above 1.2522 (is it Not 1.2566 ??) “… the high of the next bar must be above 1.2522 or below 1.2211. Just two options.… ” ??? b) Regarding the High/Low.Close/Open price , is it Not the mean/average price, right ?
Any clue on these ??
This reply has been reported for inappropriate content.
Interesting! Should be worth to watch further development of this new platform.
Agree with you @simplex. But i think we still need time for this development, this is still in the beginning … NodeJs is also interesting in my opinion …
At the moment, i am trying to fetch data from MT4 and store it to database … although i am still stuck … still trying … hope can see the light soon.This reply has been reported for inappropriate content.
The risks and restrictions of dealing with forex brokers are well known. With the help of Ethereum blockchain technology the idea of a brokerless decentralized exchange can now become reality. Spectre is the first example of this trend, you can open a demo account and try the platform here. They have also stated they plan to add margin trading with 50:1 leverage.
Thank you very much xux99,
Now i know why some friends using Ninja for Developing … and trading.
Cheers, DeskapitoThis reply has been reported for inappropriate content.
Hi great coders,
I am learning MQL , and want to know is it possible to use simple hashing in MT4 ? We know that some programming language having this ability. So, instead of using clear text string, we can use hash sha256 or sha1 (which is better than Encrypt/Decrypt in my opinion, because in decryption process we need to define a chipper key – that can lead to vulnerability, sha256 is one way encryption). We can send clear text from MT4 to other programming language and catch the return value of true/false, but i think it is not a good idea. It will be very nice if we can do it inside MT4.
Example :
MyString = “the : fox : jumps : over : a : lazy : dog”;
MyHash = SomeHashFunction(MyString);
result = “12389933246618234761832469032482346113423”;Is it possible ? Just forget this idea, if it is not worth …
Thanks-
This reply was modified 8 years, 9 months ago by
- AuthorPosts

 . i though before, that p must be much much bigger than the normal period we take (around 1.5x to 10x bigger), i think i get it now… it is for other purpose.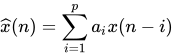
 ? I don’t think that we need Kalman filter here, right ? Any idea ? Gracias
 “…
“… 
-recurrence.png) With these empirical cumulative distribution functions we can now calculate the probability for seeing a
With these empirical cumulative distribution functions we can now calculate the probability for seeing a  )
) “…
“…