@saver0
Active 1 week, 1 day ago View
ViewForum Replies Created
- AuthorPosts
Hi @lohnere
Thank you for responding. You are right; SL is hit within 3.3 hours 97.16% of the time, so it makes sense to take a trade toward the SL direction first and then use a time-based exit.
I asked this question because there is a way to trade options with stats like these. I’m not an option trading expert, so I was hoping to hear from someone who stumbles upon stats like these to see if they can think of a way to do it.
IWM is the iShares Russell 2000 ETF. I have this loaded in my system now; the above stats are from production. And yes, these signals and more are available to subscribers.
Focus, Patience, Determination & Order in chaos
@GildedLining, would you happen to be on Discord? If so, we could chat there and talk through this and more

Focus, Patience, Determination & Order in chaos
So far, so great!
I’m doing a bit of multi-tasking, so I apologize ahead of time for any delays.
…
I plan to introduce a portfolio feature where you can configure % distribution, etc, but that’s a lot more work now. I need to wrap up what I’m doing, write up some training material, and create videos for everyone. After that, I intend to do live trading and show everyone how it works.Understood.
I think you’re doing really solid work, especially considering this is basically a one-man-show right now. I hope that I’ll be able to provide you with useful feedback along the way, not just a Santa’s Wish List of feature requests.
CRF and SPGI are now loaded up @GildedLining

Focus, Patience, Determination & Order in chaos
Hi @GildedLining
I’m now loading up CRF and SPGI for you. It should most likely be available by tomorrow. I’m doing a bit of multi-tasking, so I apologize ahead of time for any delays.
The “risk amount per trade” is designed to calculate the # of units to purchase. This is the column # that you will see in notifications and in the symbol details table. When you set the risk amount, it will automatically calculate the number of units to trade based on the SL distance. I plan to introduce a portfolio feature where you can configure % distribution, etc, but that’s a lot more work now. I need to wrap up what I’m doing, write up some training material, and create videos for everyone. After that, I intend to do live trading and show everyone how it works.
As for the “All Time since”, I have already thought of it. If you hover over the % gain badge with the mouse, it will show you since when.
Attachments:
You must be logged in to view attached files.Focus, Patience, Determination & Order in chaos
Hey everyone,
Let’s break this down so it’s super clear.
There are 3 key lines we’re working with:
Black: This is your Price Trend line.
Green: Fast Moving Average (MA) of the Price Trend line.
Purple: Slow MA of the Price Trend line.
Red/Green line (with matching background color): This is your Price Impulse line.Type 1: Inversion Setup
When the Trend line shows one direction but the Impulse line is going the opposite way, that’s your signal. You’ll notice there’s a shaded background area between the Green Fast MA and the Impulse. This highlights the expected price reversion. The exact price target could be the midpoint of the candle.Type 2: Relative Distance Setup
This one’s a bit trickier to spot but it’s still very effective. It’s based on the relative distance between the Impulse or Price and the Trend. For example, if the Trend line shows a $50 move between point A and point B, but the price itself moved $80 in that same time, we’d expect a reversion of at least -$30. It’s all about catching that difference.Type 3: Long-Term Reversion Setup
This works on longer cycles. When the Price Trend line crosses over the Fast (green) or Slow (purple) MA, we’re expecting the price to eventually return to that level after a longer time period. Keep an eye out for this—it’s another powerful reversion signal.New Feature Alert:
I’m also excited to announce that I’m wrapped up a new algorithm that detects pump-and-dump schemes for alt-coins with a 90%+ success rate. It’s in the final stages and will be available in production soon. Once it’s live, I’ll create clear tutorials to guide you through this new indicator and the pump-dump interface. The new indicator will then be released as part of any paid subscription.Focus, Patience, Determination & Order in chaos
After looking at the upper zone in H2, it would look like this and most likely where the price is going.
If I follow the same rules I was using in my post above, I only really see one valid zone in the recent examples.
Highlighted with vertical lines that I drew in myself: Significant spike of price action on the bar chart, with a severe angle deviation of the fast line in the indicator window, while also being above the slow median line, although I’m not yet sure whether that is a key confirmation rule. Edit: Oh, and I have cropped it out, but there was also a colored spike on the volume indicator, which does appear to be one of the confirmation rules.
On that timeframe I would feel compelled to disregard the other horizontal lines because they are not connected to strong enough movements of price. (But please do help me understand why/when/where I’m wrong in doing that!)You are correct in identifying the candle where you saw the price moving quickly away from the trend. These are impulses that often gets corrected.
Keep in mind that every candle can be treated individually. So, if the candle is a spike against the trend, we can expect the price to revisit back to some area within that candle. This is how there are many many impulse zones within a short number of candles. This inhrently is what drives price, this act of rebalancing itself.
You can think of what happens when large buy orders come in: it moves the price up and takes it off of balance. People see an opportunity to adjust that imbalance, and then the price comes down. It is an efficient market, so everything moves in balance.The second type I would say is when price moves in the direction of the trend but much faster relative to it’s previous movement. Like when breaking through a “support’, dropping quickly down and then retracing back up.
This is a great observation @VlanFX. Yes this is one but I put that also in Type 1. Type 1 is any impulse away from the trend will be retraced back into trend.
I can give the answer to type 2 if you like. At least my definition of it.
Focus, Patience, Determination & Order in chaos
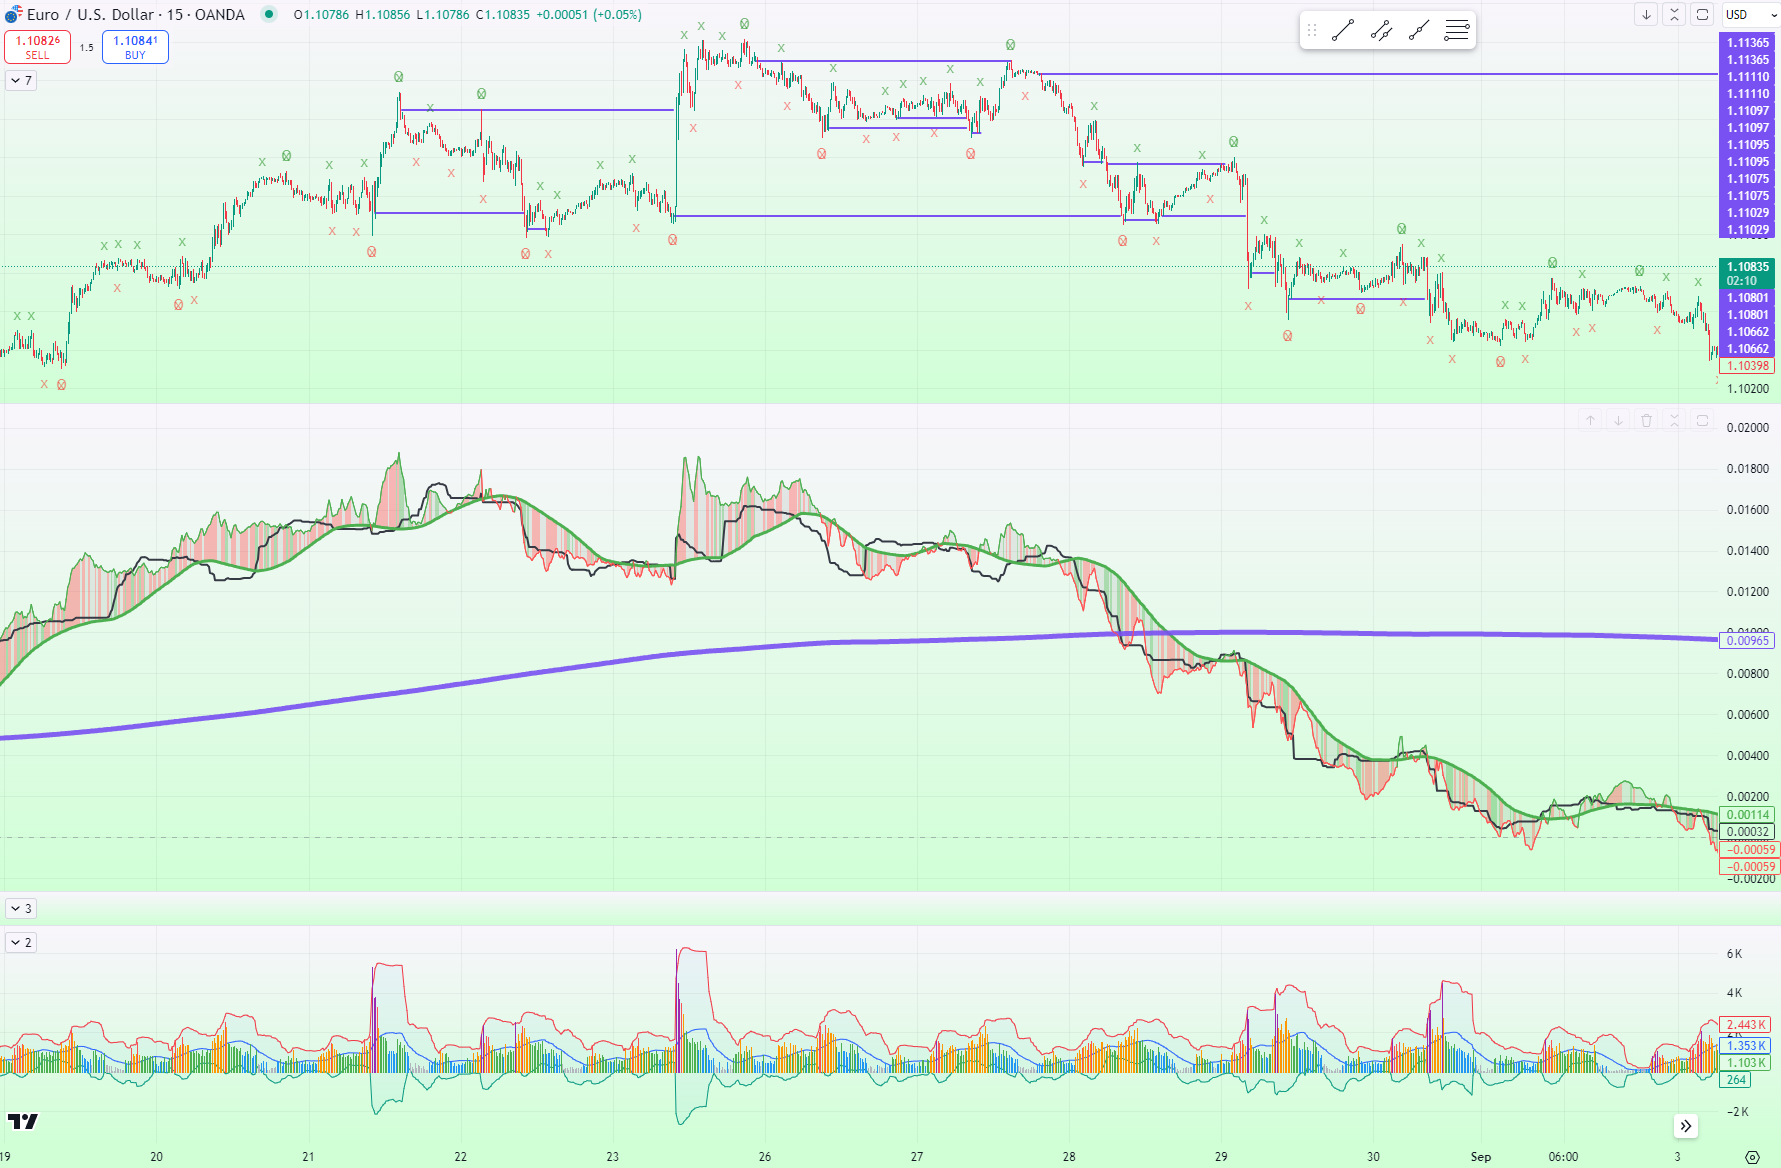
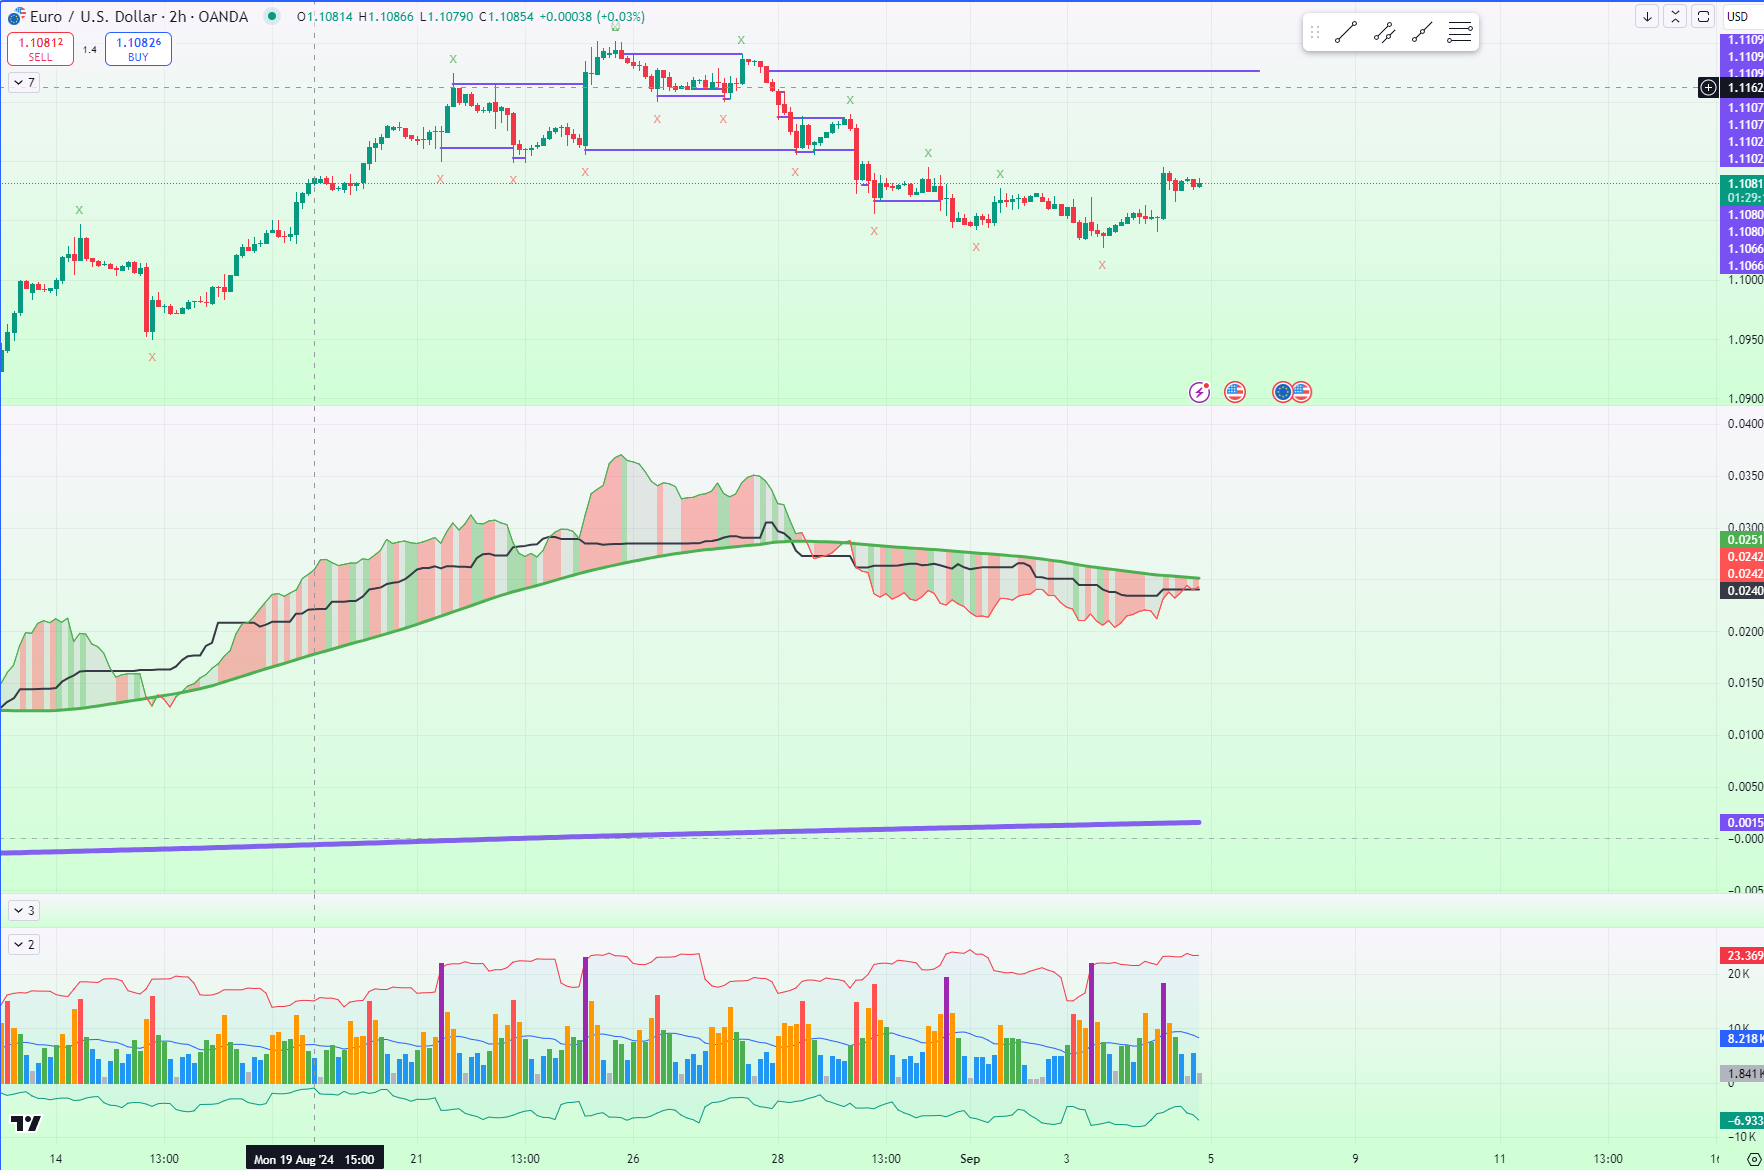
I will publish the new version of the indicator tomorrow, and you should get it through TradingView then. It makes spotting these easier. I think the best zones are validated with 2 time periods, but just looking at the M15 on EURUSD, I get this.

After looking at the upper zone in H2, it would look like this and most likely where the price is going. Since it’s a higher time period zone, it takes longer to complete the cycle.

-
This reply was modified 1 year, 10 months ago by
 Saver0.
 -
This reply was modified 1 year, 10 months ago by Saver0.
Attachments:
You must be logged in to view attached files.Focus, Patience, Determination & Order in chaos

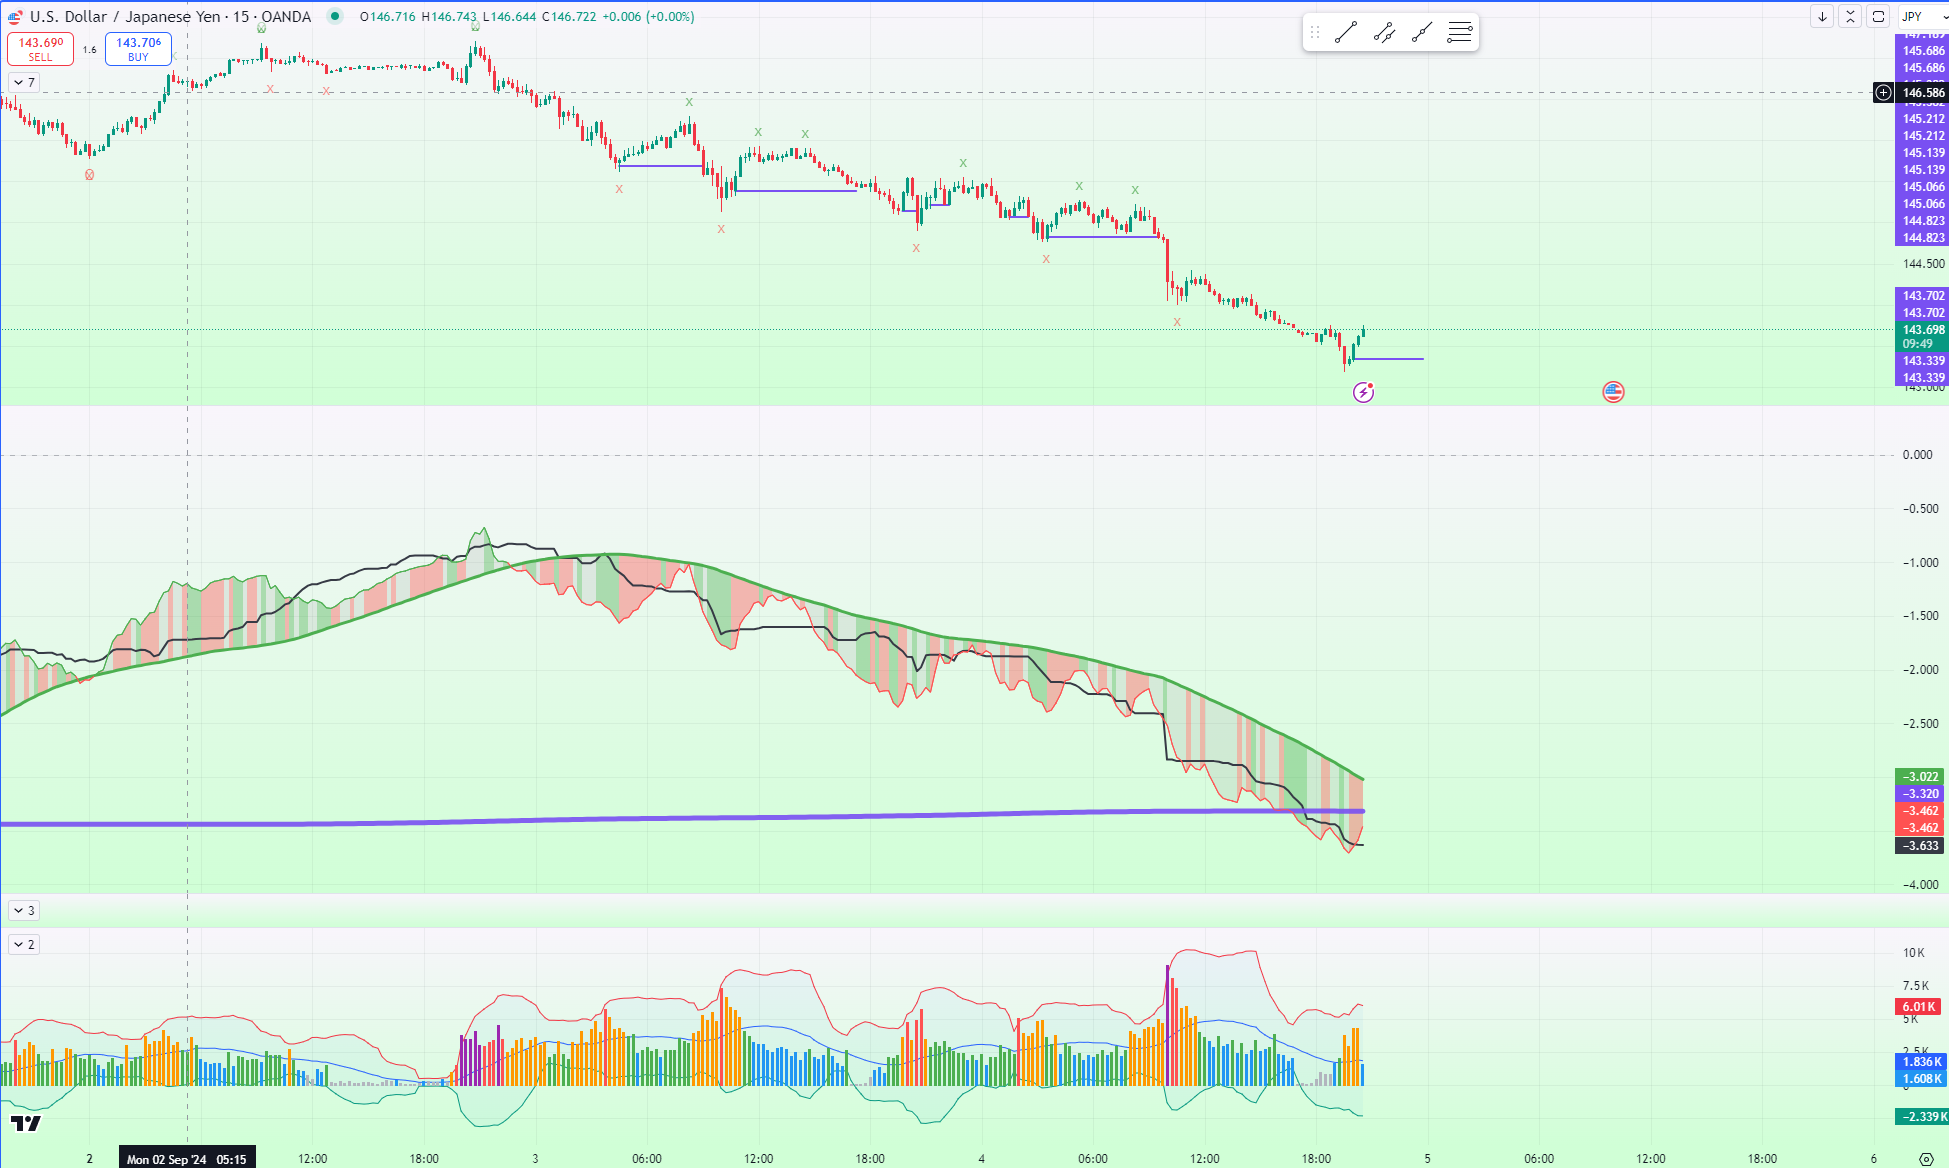
I refined the indicator I created specifically for TradingView by applying the Impulse reversion theory I use in the main trading system in Market Oracle. Unfortunately, that cannot be done in TradingView because of manycomplex computations and the optimizations it runs.
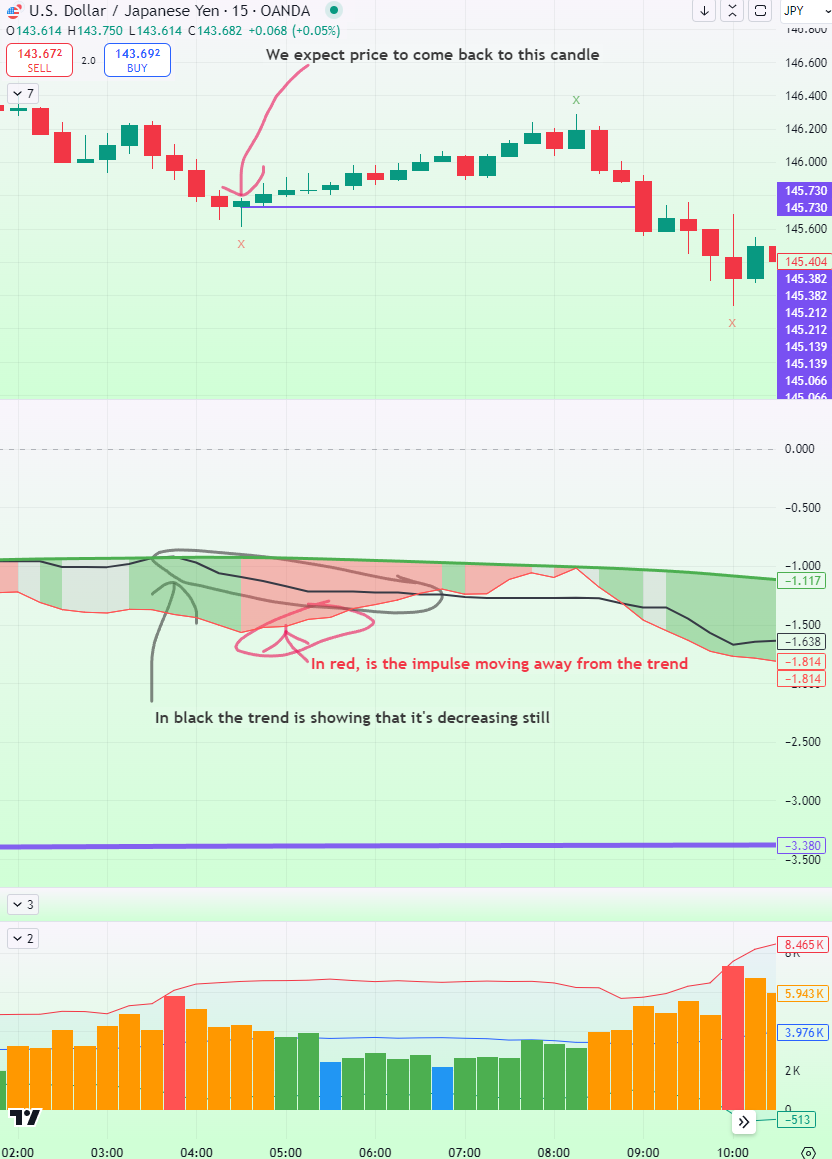
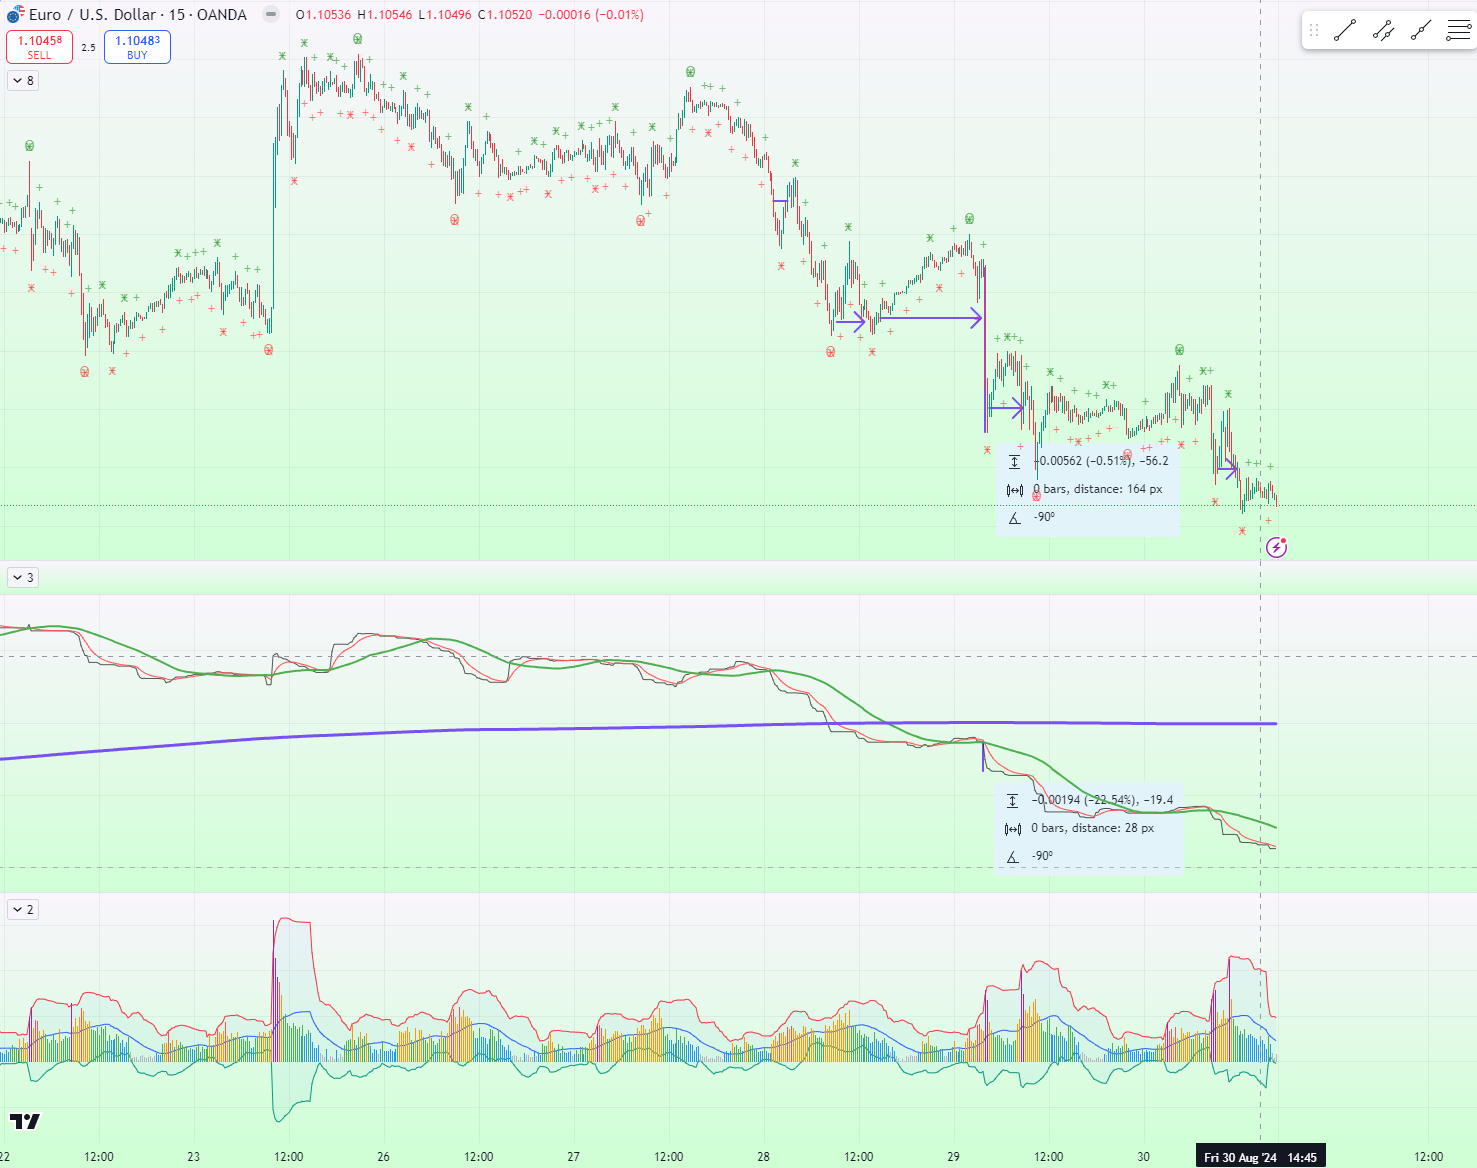
I wanted to come up with a simple indicator that we can use to capture the essence of the theory. I want to show you guys that you can trade these impulses back into trend. In the above chart of USDJPY 15Min, I have the updated version of the Impulse Reversion indicator that makes it easier to spot the change in price and the trend. Before, you had to look at the candles to see where the price was going, and you got the trend off of the indicator. Now, it’s all next to each other, and where they are inverted, we see it with red/green indicating the type of trade that should bring price to that zone area.
I added some annotations to make it easier to understand here.

Attachments:
You must be logged in to view attached files.Focus, Patience, Determination & Order in chaos
Are the colored arrow-lines auto-generated, or are you drawing those on the chart to illustrate for us?
Why are there only colored lines on the right side of the chart, not the left?
Are you specifically directing our attention to the vertical blue lines on the 29th, not any of the horizontal lines? (Seems likely, since that is indeed “finding confluence between two indicators in that moment,” as I said.)Are the colored arrow-lines auto-generated, or are you drawing those on the chart to illustrate for us?
Just some of the zones I drew to illustrateWhy are there only colored lines on the right side of the chart, not the left?
I drew only a coupleAre you specifically directing our attention to the vertical blue lines on the 29th, not any of the horizontal lines? (Seems likely, since that is indeed “finding confluence between two indicators in that moment,” as I said.)
Yes, its the trend lines in purple that I drew on the 29th on the candlestick chart and on the indicator itself.Focus, Patience, Determination & Order in chaos
Here is a live one to demonstrate
Attachments:
You must be logged in to view attached files.Focus, Patience, Determination & Order in chaos
Good observation! Time is still a key component that I haven’t cracked statistically. I’ve been told that there is a time window for reversions. My system currently uses an arbitrary time window but not a window calculated based on the price movement or candle(s). So I appreciate your comment and perhaps there is something we can develop here.
One of the types that I was getting at is the primary type, which is the easiest to detect and happens when the price moves away from the trend. This, I believe, is what experienced trend traders trade. Many use just the candle sticks, but some use simple indicators like MAs, MACDs, etc. However, in my case, I built an indicator specifically for detecting trends and impulses against a trend. Also, keep in mind that impulses against a trend are what eventually lead to the change in trend as well.
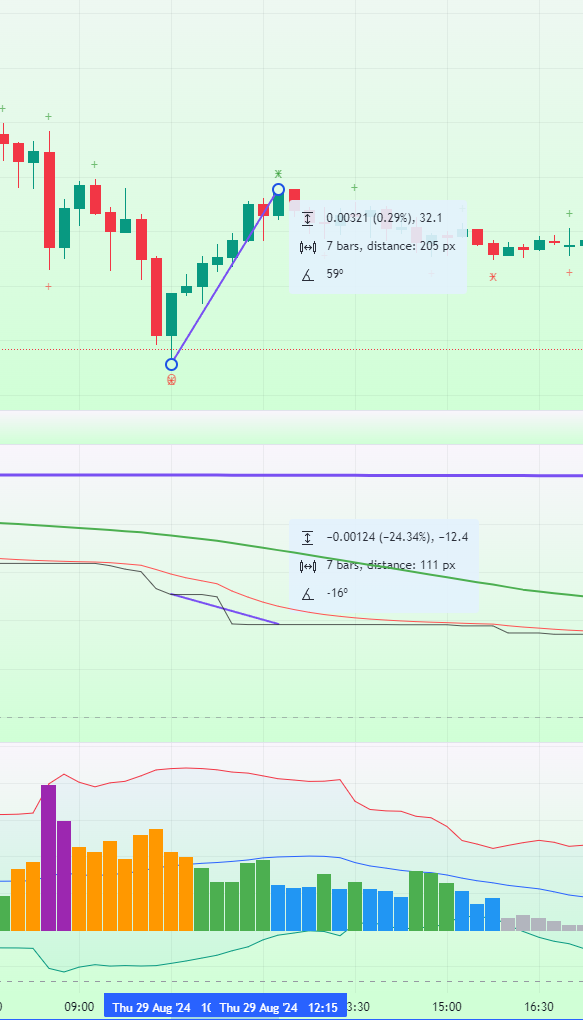
In this example, you can see the purple line I highlighted on the indicator showing -12pips down movement in trend while price prints an impulse of +32pips. This is a key reversion zone, and we would expect if not all, that most of that move to revert back to the candle from which the price started to move away.

This indicator doesn’t paint, by the way.
I will wait and see if someone can figure out what the second type is
-
This reply was modified 1 year, 10 months ago by Saver0.
Attachments:
You must be logged in to view attached files.Focus, Patience, Determination & Order in chaos
Thanks for pointing this out. This is a great illustration of how this trading system works so let me explain it. I think I missed this bit in the guide.
When the trade simulation is performed, it takes the initial capital of $100k, based on the signals for each zone, and places a trade with either a fixed amount of loss set to $1000 or 1% (compounding off/on) for that determined TP target. The signal from a zone can either be long or short but not both. So, in the simulation with both directions, we end up with more trades placed during the same period of time. This sometimes can work in our favor for some assets and against others. This is why when we take both long and short, the results won’t be the sum of short and long.
I hope it’s clear. Please let me know if it’s not.
Another thing to note is that some brokers, especially those in the US, might not have the option to take both long and short trades. In that case, we will have to pick a direction and change it based on the system’s performance and/or the user’s experience in reading trends and trend changes.
Focus, Patience, Determination & Order in chaos
I’m curious how this restart will develop. Coincides with my personal restart to FX.
Interesting!Hi Simplex!
Welcome back! I’m committed to keeping this going this time. I invested way too much time over the past three years to stop now. I believe reversion is the only edge we have and need to be highly successful. I also have a TradingView indicator that I want to share with this group. You can use it in day trading to detect these high-probability reversion zones.
The interesting thing about where we left off a few years back is that everything moved into TradingView. Unfortunately, I don’t think it’s in our best interest, but it at least simplifies some things. There are pros and cons, I guess.
Focus, Patience, Determination & Order in chaos
Hi Vlan,
Welcome back!
I just activated XAUUSD and got very good results. For the best results, make sure to look at the long-only option. You probably want to take only long signals. I expect experienced human traders to beat the results on the dashboard, so I’m hoping the users on this forum will have remarkable results.
Please take a look and let me know what you think.
Focus, Patience, Determination & Order in chaos
Perhaps I need to show something to get the conversation started.
I’m showcasing two types of reversion in this example. Can you spot them?

I’m using an indicator I made for TradingView to spot reversion areas here.
Attachments:
You must be logged in to view attached files.Focus, Patience, Determination & Order in chaos
Welcome back @PMMforex! I appreciate your vote of confidence and joining the Beta. As you start using it, you can drop into the Discord server or post your questions/feedback in this new topic that I made.
As for the system being exploited, I’m not going to share the exact details of the system that I have in production. Also, the paid product will be limited in the number of subscribers, with the top limit being 3000. I might even reduce it down to a few hundred, so we will see. I certainly do not want this to be exploited by too many people.
However, the theory itself can be applied in many different ways, so there are many permutations of reversion that you can apply to your trading. I also believe that hedge funds and the like apply reversion-type principles. I know they apply fluid dynamics to their systems, and what I’m describing isn’t too different.
I will see if we can get a few more of the old Penguins to join the conversation, and I will share more. I only sent the email to 100 users yesterday so today I will send to a few hundred more

Focus, Patience, Determination & Order in chaos
This reply has been reported for inappropriate content.
That user is gone guys! Thanks for reporting!
Focus, Patience, Determination & Order in chaos
This is interesting.. A close friend of mine’s dad actually has been trading now for over 2+yrs successfully and he retired in the beginning of the year and trading full-time now (he is extremely disciplined). I saw his strategy and its very similar to what you outlined actually. He uses slope lines in multiple time-frames and he also LOVES OBV. He trades only for 2-3 hours during highest volatility in the direction of the trend.
Just thought I should add.. keep this up
Focus, Patience, Determination & Order in chaos
Oh, almost forgot! Here is my node.js script if anyone is interested in playing around

You need to have Node.js installed in your system.
Run npm install to install the needed packages.
Then run the command node simple_probability.js in the directory.
I added some comments to the top. First you will need a data export from MT4 or EURUSD M5 data. You will need to uncomment the first section to generate the .json files. I did some formatting and saving it as JSON so its faster to load. The files are too big for attaching.If you don’t know the basics of Node.js, learn it! It’s fun and easy. Have fun!
Attachments:
You must be logged in to view attached files.Focus, Patience, Determination & Order in chaos
Hi all!
I started playing around with probabilities once again
I’m wondering if someone could verify if my probability calculations are correct.This is what I want to find out:
What is the probability of price going up 40 pips given that it has already gone up 20 pips first before going down 20 pips.
I’m observing EURUSD for this experiment using H4 bars open as the simulated entry and using M5 to see exactly if the price went up 20 pips or down 20 pips from the starting point.
Here are the numbers I have:
Total that went up 40 pips instead of down: 14894
Total that went down 40 pips instead of up: 11958
This yields a probability of 55% of success if one is to open a long trade on every H4 bar open (this just implies that EURUSD generall had a long bias since 1999)Total that went up 20 pips first and then went up 40 pips from the bar open: 11136
Total that went up 20 pips first and then went down 40 pips from the bar open: 2708
Total that went down 20 pips first and then went up 40 pips from the bar open: 3758
Total that went down 20 pips first and then went down 40 pips from the bar open: 9250Total that went up 20 pips first: 13844
Total that went down 20 pips first: 13008I was looking into conditional probability for this: https://www.mathsisfun.com/data/probability-events-conditional.html
So the P(going up 40 pips | given that it already went up 20) = P(going up 40 pips having gone up 20 pips first) / P(going up 20 pips)
Does this seems accurate?P(going up 40 pips having gone up 20 pips first) = 11136 / (11136+2708+3758+9250) = 0.415
P(going up 20 pips) = 13844/(13844+13008) = 0.516So the P(going up 40 pips | given that it already went up 20) = 0.415 / 0.516 = 0.80 = 80%
If someone could verify the above probability calculation is correct, it would be really appreciated.
If this is correct, then that means we should add to a winning trade and exit out of a loosing trade. The above probability means, when we take a trade for any direction, there is maybe ~50% probability of it going any direction (ignoring any indicators) 40pips. Let’s say we took a long trade and we observed that it went up 20pips, this means now the probability of it going 20 pips more is 80% so it would make sense to place another trade for the same 40pips TP level. However, it gets a bit interesting, this new trade, it now has 50% probability of going down 40 pips as well because its an independent event.. however, probability of it going up 20 pips vs 40pips down should be around 80% from my previous calculations (needs to be verified again). When the second trade is taking at the 20pip level from the open (when in profit of 20pips), this second trade has 50% chance of going up 20pips or down 20pips. Going down 20pips is a break even trade because you can close both trades at a zero loss (ignoring spread/commission) . But the upside is higher because higher chance the first trade will reach the profit and if it does then both trades are in the profit.
Somehow in my head, this doesn’t make sense.. see if it makes sense for anyone. Probabilities sure are interesting

Focus, Patience, Determination & Order in chaos
Thank you so much all!
It was hectic the past few months. Things are finally cooling down like the weather over here I miss spending my reading through the posts and giving something back and I will be visiting more often now
Focus, Patience, Determination & Order in chaos
This reply has been reported for inappropriate content.
@Anti
I’m continuing my discussion here from last December
http://penguintraders.com/forums/topic/nature-of-markets-randomness-probability/page/3/#post-12762-
This reply was modified 10 years ago by Saver0.
Focus, Patience, Determination & Order in chaos
Hi all!
A lot has happened in my absence from this community. There were some family things that happened but things has finally returned to “normal” and I’m finding more time to continue my research where I left off. I hope to share my findings with you here and help you all along the way.
Continuing from where I left off..
———————————————-
My first goal was to observe the market and understand it’s nature. I have been able to successfully conclude as we would expect, a randomly placed trade would have a random outcome. This means if you randomly place a long or short trade, you would expect to have 50% probability of success (if we exclude the spread/commission).My second goal is to harness the power of money management to increase the odds of winning. Where odds of winning is the net % gain of the account balance. One of the simplest ways to grow your account steadily is to make sure that you are risking/gaining a fixed percentage of account balance rather than a fixed dollar amount.
Let’s take a look at the following 2 charts.

These are the simulated account balance from a trading system with 56% win rate. The top chart you will see how the account balance grew when on a successful trade a profit of 0.5% was taken and on a losing trade a -0.6% loss was taken. This translated to $5 TP and $6 SL. If I traded a fixed TP and SL $ amount then I would have ended up with about 350% gain. However, if I adjusted size of each new trade, then I would have had 1,200% gain. Even though the win rate of each trade was only 56%, with proper compounding based money management, you can have really good gains.
Let me ask a question.. have you ever wondered if there were patterns in the market with high recurrence?
Attachments:
You must be logged in to view attached files.Focus, Patience, Determination & Order in chaos
What I mean is the following. Lets take for example what you witnessed: “I saw even NZD news shaking GBPUSD around.”
What you saw is how NZD news affects GBPUSD. The ratios of the price change between NZDUSD and GBPNZD and GBPUSD should give an indication as to the “value” of NZD priced into GBPUSD. It’s difficult to explain what’s in my head.. I assume NZDUSD and GBPNZD moved by different pip amounts. In reality, GBPUSD shouldn’t have had any affect yet you saw it move as well. This move in GBPUSD has to have some correlation with NZD and the ratio of this move I think can be used to calculate value during normal times. I will have to test this out when I have time. Also, what we know is that the price must always go back to “value”. In theory, we should be able to trade mismatches between price and value.
Focus, Patience, Determination & Order in chaos
Great work Simplex!
Have you thought of big news events to synchronize the currency components?
For example, when brexit happened, we saw how all the currencies reacted. I think this move showed how GBP is correlated with every other currency. I think from this, you should be able to extract a constant (that might only move so slightly) that can be used to find value of each currency. I haven’t had the time to test this theory but in my head it makes sense
Focus, Patience, Determination & Order in chaos
-
This reply was modified 1 year, 10 months ago by
- AuthorPosts