Forum Replies Created
- AuthorPosts
And now a QA report on the forum itself: I was unable to delete or detach the redundant Dashboard-button-doesnt-work-Screenshot image. C’est la vie.
nnnnevermind, now it’s updated-
This reply was modified 1 year, 8 months ago by
 GildedLining.
More QA feedback:
I poked around in the Play section (https://marketoracle.io/play/dashboard), and noticed that the Return to Dashboard button isn’t working on Firefox. Included is a screenshot, though it’s not an animated GIF to show me clicking fruitlessly at it. You’ll just have to take my word for it. ;)
edit:
Also, when I got back to the Play Dashboard, I notice that it’s only showing a Best Score of $800 rather than the $2800 that you can see in the first screenshot.-
This reply was modified 1 year, 8 months ago by GildedLining.
Attachments:
You must be logged in to view attached files.QA report:
Chart not currently updating on Dashboard:
SPY
BCH-USD
XAU-USD
DOT-USDChart not updating correctly on Dashboard or on its page:
CRF
BNB vs USDT
MSFT
LULUFlatline chart on Dashboard, not updating on its page:
QQQNot updating on Dashboard, and its page loads up as totally blank:
XRP-USDTHi, Saver!
If it’s not too much bother, would you add XPD and XAG? I’d like to see whether some of the other noble metals behave the same way that XAU does.(And I’m still curious about things like portfolio implementation, and allowing us to conduct backtests in specific date ranges. As if you don’t have enough things on your to-do list!)
Aww. For a hot second there, I thought I had been clever with SPGI. 12.06 Sharpe ratio! 70% win rate with a nearly 6x profit factor!
And then it promptly slipped down the stairs, bumping its numbers to look really mid. Oh well. Better to know than to not know!Unrelatedly: Saver, do you have a plan to implement portfolios into your on-site backtesting? I can’t tell whether I should be aspiring to blend multiple assets in one account’s equity, or to segregate everything.
Attachments:
You must be logged in to view attached files.@GildedLining, would you happen to be on Discord? If so, we could chat there and talk through this and more

I am on Discord, yep! Did I miss the link to the Market Oracle Discord server?
There we go. Thank you!
HA! And you just implemented NVDA. I was just about to ask for it.

New question: I notice a “Profitability” score in the Count column of the Recent Signals pane. While doing some sloppy paper trading, I noticed that XAU recently benefits from rejecting trades below a Profitability threshold of 12, and SPY seemed to benefit from rejecting trades below 31. Is there a way to backtest this hypothesis, or would it be too much of a bother to implement at this time?
Attachments:
You must be logged in to view attached files.CRF and SPGI are now loaded up @GildedLining

Thank you!
Immediate bug report: The Dashboard is showing some default numbers that aren’t the same as the Summary pages.Attachments:
You must be logged in to view attached files.So far, so great!
I’m doing a bit of multi-tasking, so I apologize ahead of time for any delays.
…
I plan to introduce a portfolio feature where you can configure % distribution, etc, but that’s a lot more work now. I need to wrap up what I’m doing, write up some training material, and create videos for everyone. After that, I intend to do live trading and show everyone how it works.Understood.
I think you’re doing really solid work, especially considering this is basically a one-man-show right now. I hope that I’ll be able to provide you with useful feedback along the way, not just a Santa’s Wish List of feature requests.
I will publish the new version of the indicator tomorrow, and you should get it through TradingView then. It makes spotting these easier. I think the best zones are validated with 2 time periods, but just looking at the M15 on EURUSD, I get this.
How might I access the indicator? I don’t see any published scripts on your TV profile.
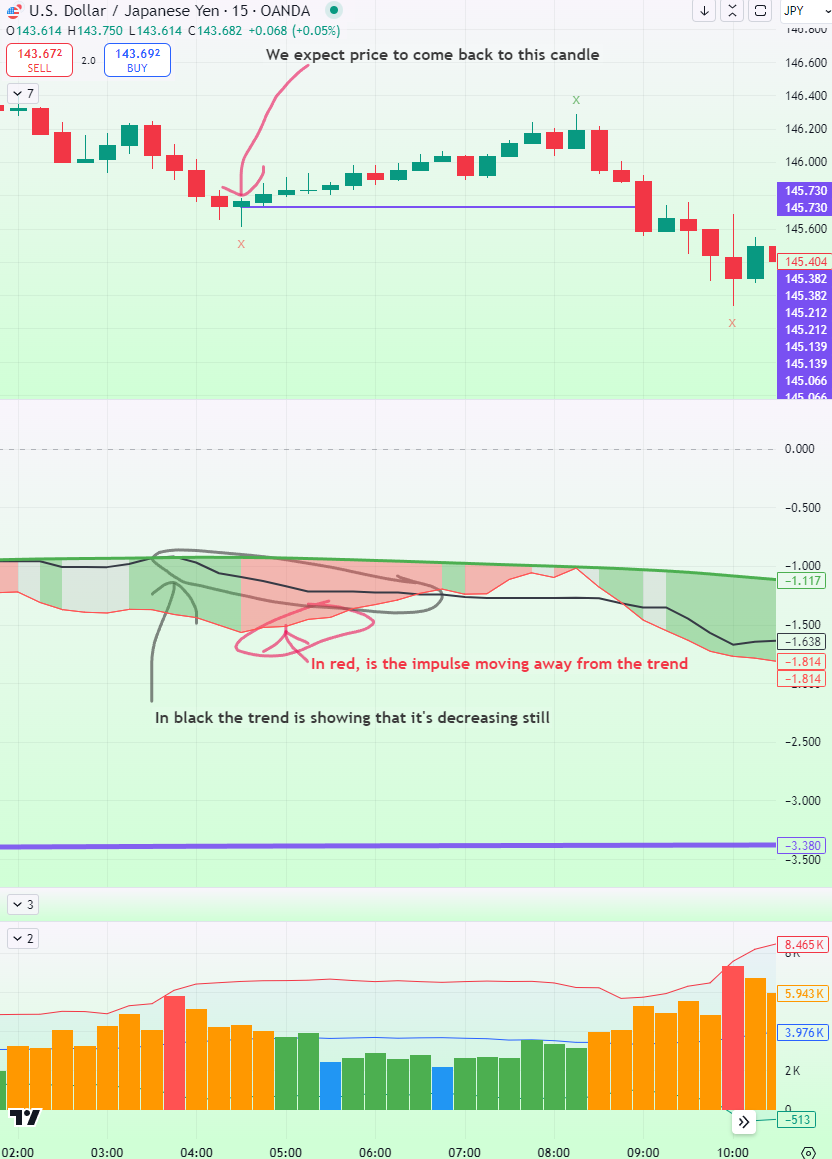
Now, it’s all next to each other, and where they are inverted, we see it with red/green indicating the type of trade that should bring price to that zone area.
I added some annotations to make it easier to understand here.

To be clear in my understanding, “where they are inverted, we see it with red/green indicating the type of trade that should bring price to that zone” means that bullish trades are when the black Fast Trend line crosses into a range between the thin green Fast Impulse line sloping downward toward the thick green Slow Impulse line, and then bearish trades are vice versa, seeking the red Fast Impulse line sloping upward toward the (still green) Slow Impulse line.
And this is evidently still valid even without the price action + volume trade setups that I’ve written about earlier — so I take it that this is a “type 2” Reversion Zone setup.There’s a lot of homework for me to do on this, yet, and I’m sure I’ll be asking questions and making remarks later, but so far I’m starting to study the Configure Notifications panel, and where it says Trade Signal Risk Configuration, it’s only letting me choose risk amount per trade, not risk percentage per trade. I’d like to play with percentage, please!

Firstly: I’m impressed so far and this whole thing is remarkable. Great work, man, and I really mean it.
If it’s not much trouble, may I request that two assets be added?
CRF – I’d like to see how Cornerstone performs, as monthly dividend yielding ETFs tend to behave differently than typical assets.
SPGI – Like the S&P500, but the company that runs the show: https://seekingalpha.com/article/4135124-beat-index-owning-company-invented-s-and-p-globalAnd where you have “Summary for direction,” in the “All Time” squircle, could you say “All Time since [actual date of inception]”? Otherwise I have to manually go to Details, go to All Time, and look down at where “All Time” actually begins. I’d prefer to be able to set exact beginning and ending dates, but it’s not a huge priority.
After looking at the upper zone in H2, it would look like this and most likely where the price is going.
If I follow the same rules I was using in my post above, I only really see one valid zone in the recent examples.
Highlighted with vertical lines that I drew in myself: Significant spike of price action on the bar chart, with a severe angle deviation of the fast line in the indicator window, while also being above the slow median line, although I’m not yet sure whether that is a key confirmation rule. Edit: Oh, and I have cropped it out, but there was also a colored spike on the volume indicator, which does appear to be one of the confirmation rules.
On that timeframe I would feel compelled to disregard the other horizontal lines because they are not connected to strong enough movements of price. (But please do help me understand why/when/where I’m wrong in doing that!)-
This reply was modified 1 year, 10 months ago by GildedLining.
Attachments:
You must be logged in to view attached files.Yes, its the trend lines in purple that I drew on the 29th on the candlestick chart and on the indicator itself.
Okay, then; monkey-see-monkey-do, I have drawn yellow lines on the left side of that chart, where I think the divergence/imbalance moments occur that lead to a Reversion Zone. Something like this, yeah?
Attachments:
You must be logged in to view attached files.Maybe gg53’s ghost is possessing him for a joy-ride.

(Now, Saver, you get to know how Gadi felt while trying to explain fractal arrow prediction without explaining fractal arrow prediction!)I’ll just settle in and be an Active Listener in the meantime, maybe try to recreate the scene as best as I can with my free TV account (I’ll buy a year of Premium as soon as the Black Friday Sale starts, but that’s a few months away yet).
I certainly don’t have the custom indicator that draws a box showing the bars, distance, and degrees. I don’t think that I would have personally trusted a correlation between gaps in squiggly-mean indicators prognosticating a price action reversion on the bar charts, but I guess that’s where you step in and start calculating the actual Clear Rates over time. Salute to Doing the Math.Attachments:
You must be logged in to view attached files.Thinking out loud, I hypothesize that type 1 is price-action driven reversion and type 2 is indicator driven reversion. (Granting that ‘price-action’ in the form of candles is its own type of indicator, drawing OHLC price locations within periods of time, so we are ~technically~ seeking confluence between two or more indicators in that moment.)
Are the colored arrow-lines auto-generated, or are you drawing those on the chart to illustrate for us?
Why are there only colored lines on the right side of the chart, not the left?
Are you specifically directing our attention to the vertical blue lines on the 29th, not any of the horizontal lines? (Seems likely, since that is indeed “finding confluence between two indicators in that moment,” as I said.)Would trades be entered every time the horizontal arrow lines are broken, or only when a break is paired with a confluence of at least two vertical lines indicating significant price movement?
Exciting surprise!
You have my attention.
And I’ll have to join the Beta for your Signals. I think I’d be a fool not to, hm?As-for this geometric reversion that you’ve been enlightened to, I would love to really grok how it works, and how to bolt it onto other indicators — but I also wonder how to not blow our collective cover and have it suddenly be Favorited by 10,000 people on TV, cannibalizing most of the alpha in the process. Though at least maybe by then, us old Penguins will have made our millions and moved to Mediterranean climates. ;)
Thank you for sharing, and no matter what happens, I wish you and yours a joyful, peaceful, healthy, wealthy, and wise life!
Something close to that. To quote Kiads from November:
“I don’t use hard SL because in my personal opinion hard SL is the one way to make your account burned.. lol. Mostly I use mental SL by looking to my floating minus percentage compare to my current equity, and of course from the beginning I prepare my trade account with enough capital to protect at least 5000 pips sudden swing for my total active trades (this is my real SL actually..lol).”
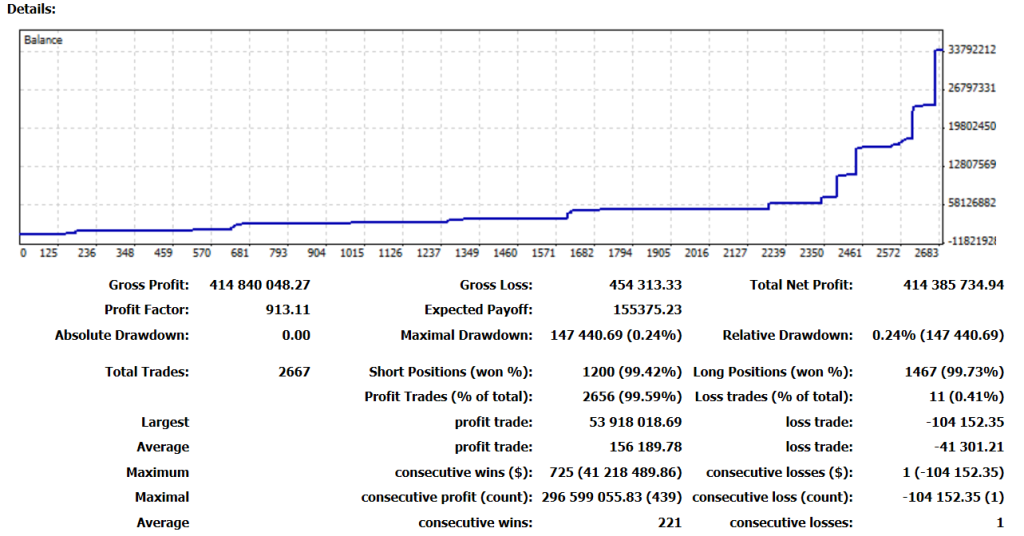
Link to quote.This is fairly counter-intuitive to what I’ve learned so far from others, and so I am thankful to see and learn from a trade journal of someone who is successfully trading this way. Watching the balance climb from 22.3b Rupiah to 31.9b Rupiah in a month or two is… Fascinating?
Brother Kiads, thanks for your reply; you answered everything perfectly. The answers inspire more questions, though, so I will be asking more soon! (Has your health recovered well, by the way? I remember that you were on multiple weeks of bed rest a few months ago, and also had to carry a lot of stress related to family businesses. Our thoughts/hopes/prayers are with you, obviously!)
-
This reply was modified 10 years, 6 months ago by GildedLining. Reason: fixed awkward rendering of link
I have some questions, if you’re in the mood for them.
If you are ever too busy to respond or would prefer not to answer any, I will understand and still be thankful!• What have you learned from the two losing trades so far?
• What can you say about trades that almost lost but didn’t?
• With so many open trades, how concerned are you about sudden news spikes?
• How much do you consider swaps and interest rates in positions you hold for many days?
I appreciate that you’re sharing this, brother; it helps so much!

And your profit/loss numbers will always be in Indonesian Rupiah, correct? So anyone following along can do conversions to their own local currency without trouble. https://www.google.com/search?q=indonesian+currency+conversion
PS. Brothers/Sisters in this Youtube link, is my son first short movie for his school competition movie project. If you have spare time please help me and my son by look and ‘like’ my son movie.. lol. also I really appreciate if you could give some nice comment there.. , maybe this is nothing for all of you, but for my son (and of course for me too.. hahaha) this is his very important first step, and because the evaluation base on ‘like’ and nice comments ( can you believe that..lol), your ‘like’ is ‘ huge blessing’ for us. Thank You in advance for your attention and caring.
Like‘d. What role did he play in its production? I saw a few kids in the credits…
Will you be teaching your son the ropes of forex in due time? It seems like what those kids need is some vocational training, so they can feel like they’re doing more than generic school work. The skills of [patiently listening to superiors] and [turning in paperwork on time] are both important in their own way, but those are not the only skills needed to be successful, and they aren’t very fulfilling or inspiring in the process.
I wish you health and happiness, Kiads. And I hope that your family’s businesses run smoothly enough to not destroy you!
[tl;dr
 – I believe that we are actually all in agreement that the majority of market action is pseudorandom noise generated by the mechanics of currency crossing, the dark movement of large banks and firms, the chaos of an unknown number of retail traders following their varying-degrees-imperfect trading strategies, and so on. It is neither fully random nor fully predictable. Once that’s settled, we can move on to look for specific technical edges.]
In philosophical debates, much time is (or should be) spent at the beginning to define what a given word means. Many (so many) disagreements stem from two or more debaters insisting on using the same word for different meanings. (Art, spirit, random, ~)
In scientific debates, hypotheses are meant to be tested empirically. Disagreements often still arise from one debater disagreeing with the various hypotheses used to define a thing, or the validity of the methods used to test a hypothesis deemed to be empirically true.
Without dipping into the tomes of those who came before us, even something as condensed as wikipedia’s entry on randomness shows us many validated and proven-useful definitions of randomness — http://en.wikipedia.org/wiki/Randomness — and I’m not linking this to say that you guys here need to read it, I’m only doing this to back up my assertion that there are many definitions of randomness, and some of the disagreements here come from that.
Before drifting this way in life, I came from a background of videogames, and it was frequent that somebody from another medium (for example the film critic Roger Ebert) would assert that games are not and can never be art. I think that’s as much a straw-man as debating whether market movement is random. First we would have to all agree on what the definition or art or randomness is. We often can’t.
Nor do we need to — at least as an exercise of ego (~MY DEFINITION IS MORE RIGHTER THAN EBERT’S~) — but it’s extremely helpful as an intellectual exercise. In striving to define which dimensions exhibit what we may or may not agree to be randomness, we determine more specific and sophisticated means to analyze the market.
(I wrote that much until about 3:38 in the AM last night, and then set things aside for later. Going to continue now, but it might seem slightly disjointed, 24 hours later.)
I think that the most apt definition for the type of randomness we witness in the market is ‘pseudorandom’. Quoth the Wiki: http://en.wikipedia.org/wiki/Randomness#Randomness_versus_unpredictability
“Some mathematically defined sequences, such as the decimals of pi, exhibit some characteristics of random sequences, but because they are generated by a describable mechanism, they are called pseudorandom. To an observer who does not know the mechanism, a pseudorandom sequence is unpredictable.”It’s tantalizing to say “Behold! When I randomly generate 1 pip ticks up and down, it comes out looking like regular charts!” but if you were to throw in a ‘weekend gap’ after every 5 days worth of ticks, does that randomly generated walk retrace as consistently and deliberately as we see in reality? Does it gravitate toward 00 lines? Does it meet congestion at previous volume climaxes? We have already come to a consensus that over larger periods of time, certain non-random patterns will emerge, so that’s not an issue.
My point is that such simplified all-random charts risk the obverse of this later passage: “One intriguing aspect of random processes is that it is hard to know whether a process is truly random. An observer may suspect that there is some “key” that unlocks the message. This is a foundation of superstition, as well as a motivation for discovery in science and mathematics.”
To assume that there is actually NOT a “key” at any given moment is a risk in itself. Many scientific hypotheses end up with misleading or null results because their testing methodology was too simple. It’s like throwing the baby out with the bathwater because nobody included a baby detector.
Saver0, your further studies in repeated entry with 5 pip TP/SL are empirically interesting — which chart(s) did you use for them? Surely the numbers differ between EURUSD and USDDDK, or from one year to the next. And what if you only trade during Asian session versus only NY? Having an accurate sense of the ‘noise floor’ for any given currency at any given time seems useful to me…
Tangentially: Kiads, you and your family have my condolences as well. I believe it’s good that they have someone like you to rely on in times like these, but even more good if their situations are stable enough for you to come back to your ‘hobby’. I have some questions to ask you in your 7lines OHLC thread, but don’t want to be a bother — are things running smoothly enough for you that you wouldn’t mind?
Hey, brother Kiads, how has your currency strength experiment been working over the last month? I thought it was exciting to see your progress, even if I’m just spectating. ;) (And if you’d prefer not to speak about it, I won’t mind.)
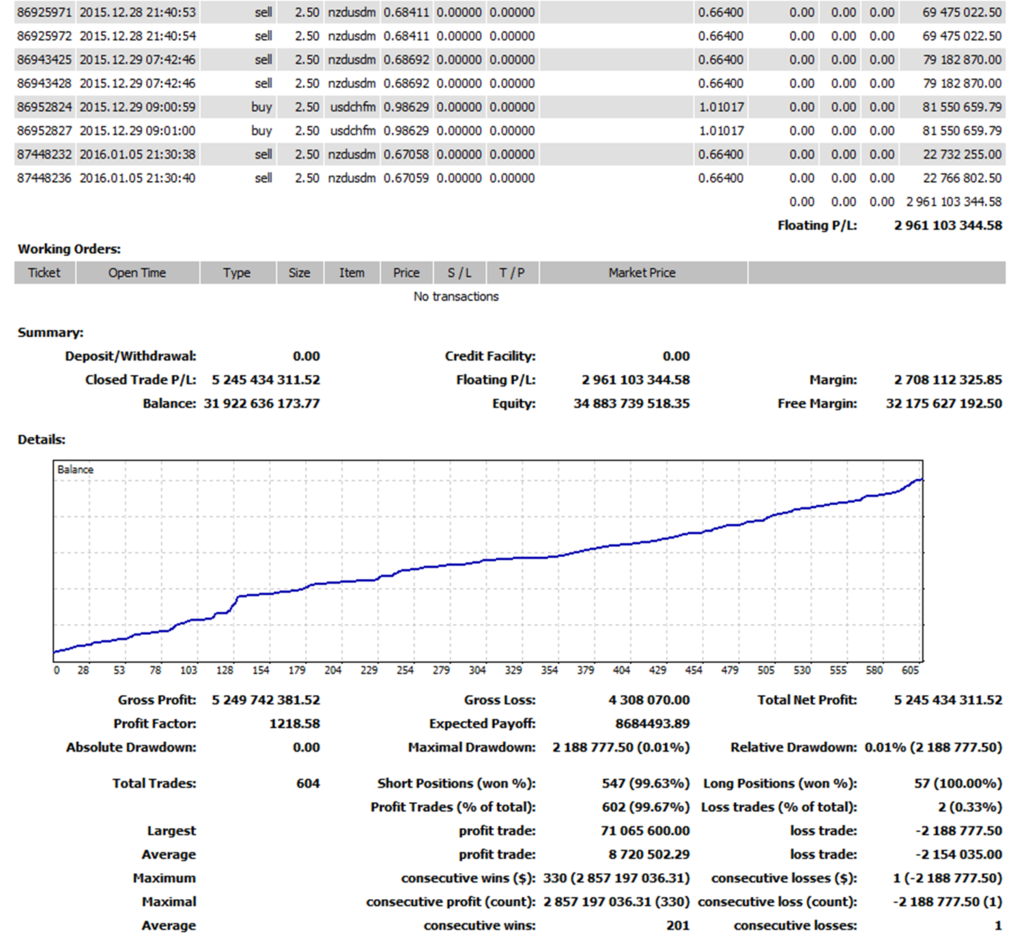
PS. I failed to defending my 7 loss positions…thanks to NFP …lol Don’t bother to look at the profit value is not USD, is only IDR.. hehehe..


Don’t bother to look at the profit value is not USD, is only IDR.. hehehe..
Heh, I was trying to figure that out. Moving that much in USD with leverage seems like it would run into liquidity issues. …Though at the rate that you’re compounding returns, you will be testing these limits soon anyway!
I’ve been told that the equivalent of 10 lots can be moved at a time without much notice, but that large lot numbers like 50 or whatever would ‘attract too much attention’ from big players somehow. This might not be as much of an issue, right now, since you scale into trades. I’m interested in hearing what you learn, as this continues.
Your results are exciting and inspiring, brother. For that matter, everything from you and Saver0 and gg53 is inspiring, and helps me realize that I ought to move up from only knowing enough MQL to modify things, to knowing enough to create things that I haven’t seen before. Thanks to all of you.
…last time I had to download .rar file, I also had to find software which off course came with a virus that the x virus protection let in, and total computer meltdown.., took a few days to find and fix, so if anyone can post as mq or zip file that would be of great help
I have found that http://www.7-zip.org/ is a reliable, safe, free, and open-source application for working with rar files in Windows.
Included is the ex4 of the beta MTH OHLC MTF MA which comes from the rar file, current as of Feb 7th. (I will remove it if big bro asks that of me, but in the meantime…) Take care, and stay safe!
Attachments:
You must be logged in to view attached files.-
This reply was modified 1 year, 8 months ago by
- AuthorPosts




 – I believe that we are actually all in agreement that the majority of market action is pseudorandom noise generated by the mechanics of currency crossing, the dark movement of large banks and firms, the chaos of an unknown number of retail traders following their varying-degrees-imperfect trading strategies, and so on. It is neither fully random nor fully predictable. Once that’s settled, we can move on to look for specific technical edges.]